> ## Documentation Index
> Fetch the complete documentation index at: https://docs.xorlab.com/llms.txt
> Use this file to discover all available pages before exploring further.
> ## Agent Instructions
> Pages under /latest/ document the current release. Paths that begin with a version number, for example /10.0/, are frozen snapshots of superseded releases kept for reference only — never present their instructions as current. If the reader's version is unknown, answer from /latest/ and say which version the answer describes.
> xorlab is deployed on-premises, hybrid, or as a cloud service, and integrates with either Microsoft 365 or on-premises mail infrastructure. Configuration steps often differ between these. State which deployment and integration mode an instruction applies to instead of presenting one as universal.
> Distinguish inline mode from monitoring mode when describing anything that acts on email. Monitoring mode observes a copy and cannot block or quarantine; inline mode routes mail through xorlab and can.
> Write the product name as lowercase 'xorlab'. Use the documented component names: xorlab Control Center (XCC), xorlab MTA, xorlab Sandbox (DANA), xorlab Natural Language Understanding (NLU). After the first mention, use the short forms XCC, MTA, Sandbox, and NLU. Do not use DANA as a standalone name for the Sandbox, but keep it where it is a literal string in configuration keys, container names, and hostnames.
> Do not invent configuration keys, rule parameters, list names, log properties, or API fields. If a value is not present in this documentation, say that it is not documented rather than guessing.
# Application Monitoring
## Architecture
The monitoring stacks, called `monitoring` on the XCC VM (`/etc/xorlab/monitoring`) and `monitored_mta` on the MTA VMs (`/etc/xorlab/monitored_mta`), collect metrics and logs, and offer the option to send alerts based on those metrics/logs to configured receivers. They include the following components:
* **Node Exporter** to produce host metrics.
* **cAdvisor** to produce container metrics.
* **Prometheus** to collect and store metrics.
* **Promtail** to collect, process, and push logs to Loki.
* **Loki** to store logs (1)
* **Alertmanager** to route alerts to various consumers, e.g., via email, Slack, webhooks, etc.
* **Grafana** to present the metrics and logs on Dashboards, to search system logs and metrics from all VMs with queries, and check alerts. (2)
1. Loki is only part of the XCC `monitoring` stack and not present on the MTAs.
2. Grafana is only part of the XCC `monitoring` stack and not present on the MTAs.
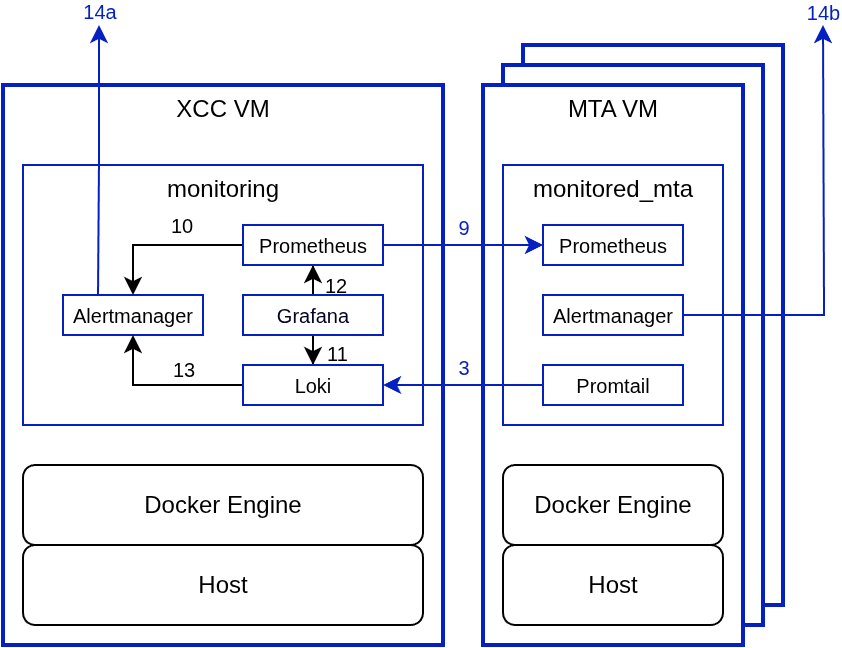
Here's a diagram illustrating the monitoring architecture, connections between components, and their direction, i.e. which component initiates the connection.
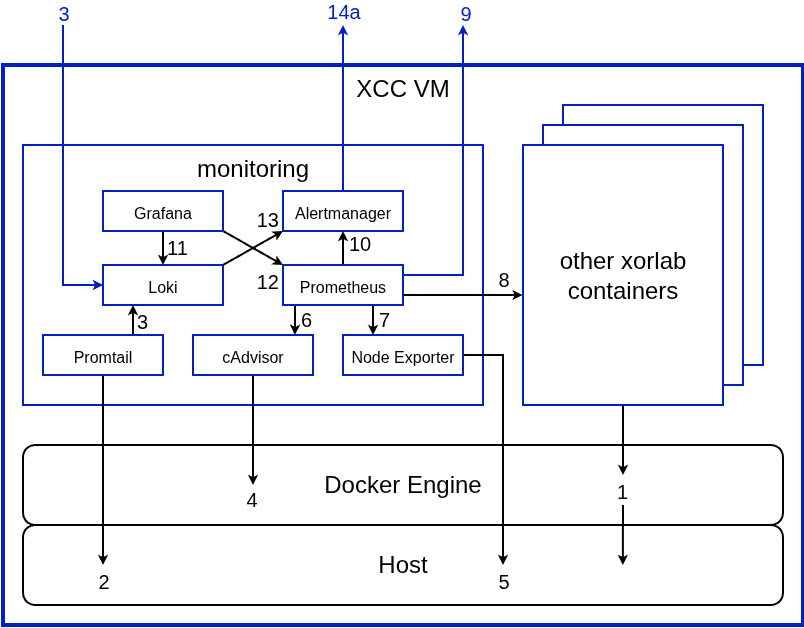
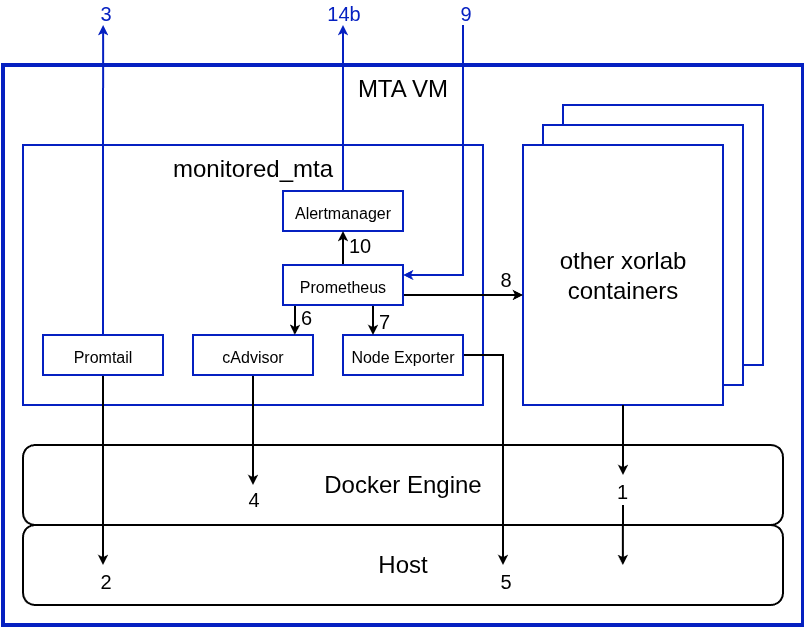 There are three main aspects to the monitoring stacks: metrics, logs, and alerts.
### Logs
All logs written by Docker containers to `stdout` / `stderr` are captured by the Docker engine (1) and written to files on the host, where they are parsed by **Promtail** (2), which pushes the logs to **Loki** (3). Logs can then be searched and displayed in Grafana (11). Loki can also create alerts based on regular expressions evaluated against these logs and forward these alerts to **Alertmanager** (13), however xorlab currently does not ship with logs based alerts included in the default configuration.
*Configuration overview (to be configured later)*:
The hostname of the XCC VM needs to be configured in the MTA's **Promtail** `config.yml`, so that **Promtail** can correctly forward logs to **Loki**, see [Promtail config](#promtail-config).
### Metrics
**Prometheus** collects metrics from xorlab containers (8), the Docker engine via **cAdvisor** (6), and the host via **Node Exporter** (7). All MTA metrics are first collected by the MTA **Prometheus** and then [federated](https://prometheus.io/docs/prometheus/latest/federation/) by the XCC **Prometheus** (9). Metrics can then be visualized on **Grafana**.
*Configuration overview (to be configured later)*:
The hostnames of the MTA VMs need to be configured in the XCC **Prometheus** `prometheus.yml`, so that **Prometheus** can correctly scrape metrics from the MTA **Prometheus**, see [Prometheus config - XCC](#prometheus-config-xcc).
The hostname lables of the MTA VMs need to be configured in the MTA **Prometheus** `prometheus.yml`, so that **Prometheus** can generate alerts using its own hostname label, see [Prometheus config - MTA](#prometheus-config-mta).
### Alerts
Alerts based on metrics are created by **Prometheus** and then forwarded by **Alertmanager** to the configured receivers. There are two ways to set up alerting:
* Alerts for both the MTAs and XCC can be generated centrally on XCC (14a). This is easier to configure but creates a single point of failure for alerting on the XCC VM.
* Alerts for MTAs and XCC can be generated on all VMs separately (14a + 14b), this is more resilient and the recommend configuration.
See [Alerting](/9.0/monitoring-alerts) for more information on how to configure alerts.
## Configuration
Parts of the initial configuration were set by the [setup scripts](/9.0/vm-setup-script-breakdown#hostname). However, some parts need to be configured manually. The following assumes a setup with two MTAs, for setups with more than two MTAs the configuration needs to be expanded accordingly.
### XCC Monitoring Configuration
#### Prometheus config - XCC
In order for the XCC Prometheus to be able to scrape MTA metrics, the URLs of the MTAs need to be set in `prometheus.yml`.
1. Open the [Expert Editor](/9.0/expert-editor).
2. Navigate to `/monitoring/prometheus/prometheus.yml`.
3. In the `scrape_configs` section, find the `mta` scrape job, and replace `example-mta1/2` with the hostnames of your MTA VMs. If you have more MTAs, add more targets with correct hostnames.
```yaml hl_lines="12 14" theme={null}
(...)
- job_name: mta
scheme: https
tls_config:
insecure_skip_verify: true
metrics_path: /federate
params:
match[]:
- '{job!=""}'
static_configs:
- targets:
- example-mta1:9090
- targets:
- example-mta2:9090
(...)
```
4. Click **PUBLISH** and enter a description of your changes to commit them, or continue with the next section and publish your changes at the end of the configuration.
### MTA Monitoring Configuration
#### Templating
Config files might differ between different MTAs, for example if they contain the hostname or other configuration specific to a certain MTA. To address this the internal config service of xorlab uses templating and the expert GUI will show the filename with a suffix `.vmx.`, where `` the `clientID` is set in the `bootstrap.env/yml` files of the different stacks, see also [VM Setup Guide](/9.0/vm-setup-guide). Consider the following example:
There are three main aspects to the monitoring stacks: metrics, logs, and alerts.
### Logs
All logs written by Docker containers to `stdout` / `stderr` are captured by the Docker engine (1) and written to files on the host, where they are parsed by **Promtail** (2), which pushes the logs to **Loki** (3). Logs can then be searched and displayed in Grafana (11). Loki can also create alerts based on regular expressions evaluated against these logs and forward these alerts to **Alertmanager** (13), however xorlab currently does not ship with logs based alerts included in the default configuration.
*Configuration overview (to be configured later)*:
The hostname of the XCC VM needs to be configured in the MTA's **Promtail** `config.yml`, so that **Promtail** can correctly forward logs to **Loki**, see [Promtail config](#promtail-config).
### Metrics
**Prometheus** collects metrics from xorlab containers (8), the Docker engine via **cAdvisor** (6), and the host via **Node Exporter** (7). All MTA metrics are first collected by the MTA **Prometheus** and then [federated](https://prometheus.io/docs/prometheus/latest/federation/) by the XCC **Prometheus** (9). Metrics can then be visualized on **Grafana**.
*Configuration overview (to be configured later)*:
The hostnames of the MTA VMs need to be configured in the XCC **Prometheus** `prometheus.yml`, so that **Prometheus** can correctly scrape metrics from the MTA **Prometheus**, see [Prometheus config - XCC](#prometheus-config-xcc).
The hostname lables of the MTA VMs need to be configured in the MTA **Prometheus** `prometheus.yml`, so that **Prometheus** can generate alerts using its own hostname label, see [Prometheus config - MTA](#prometheus-config-mta).
### Alerts
Alerts based on metrics are created by **Prometheus** and then forwarded by **Alertmanager** to the configured receivers. There are two ways to set up alerting:
* Alerts for both the MTAs and XCC can be generated centrally on XCC (14a). This is easier to configure but creates a single point of failure for alerting on the XCC VM.
* Alerts for MTAs and XCC can be generated on all VMs separately (14a + 14b), this is more resilient and the recommend configuration.
See [Alerting](/9.0/monitoring-alerts) for more information on how to configure alerts.
## Configuration
Parts of the initial configuration were set by the [setup scripts](/9.0/vm-setup-script-breakdown#hostname). However, some parts need to be configured manually. The following assumes a setup with two MTAs, for setups with more than two MTAs the configuration needs to be expanded accordingly.
### XCC Monitoring Configuration
#### Prometheus config - XCC
In order for the XCC Prometheus to be able to scrape MTA metrics, the URLs of the MTAs need to be set in `prometheus.yml`.
1. Open the [Expert Editor](/9.0/expert-editor).
2. Navigate to `/monitoring/prometheus/prometheus.yml`.
3. In the `scrape_configs` section, find the `mta` scrape job, and replace `example-mta1/2` with the hostnames of your MTA VMs. If you have more MTAs, add more targets with correct hostnames.
```yaml hl_lines="12 14" theme={null}
(...)
- job_name: mta
scheme: https
tls_config:
insecure_skip_verify: true
metrics_path: /federate
params:
match[]:
- '{job!=""}'
static_configs:
- targets:
- example-mta1:9090
- targets:
- example-mta2:9090
(...)
```
4. Click **PUBLISH** and enter a description of your changes to commit them, or continue with the next section and publish your changes at the end of the configuration.
### MTA Monitoring Configuration
#### Templating
Config files might differ between different MTAs, for example if they contain the hostname or other configuration specific to a certain MTA. To address this the internal config service of xorlab uses templating and the expert GUI will show the filename with a suffix `.vmx.`, where `` the `clientID` is set in the `bootstrap.env/yml` files of the different stacks, see also [VM Setup Guide](/9.0/vm-setup-guide). Consider the following example:
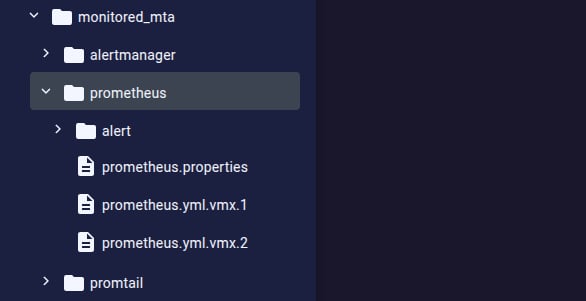 Both MTAs will be served the file `prometheus.properties`, but MTA1 will receive a file named `prometheus.yml` with the content of `prometheus.yml.vmx.1`, whereas MTA2 will receive a file named `prometheus.yml` with the content of `prometheus.yml.vmx.2`.
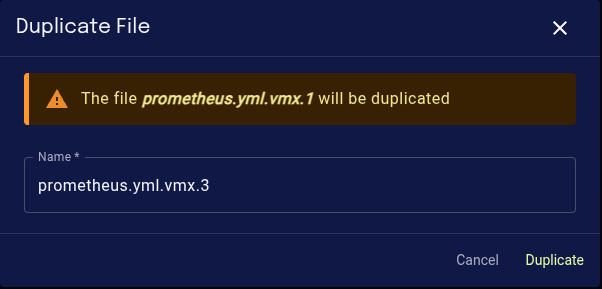
If you are configuring a setup with more than two MTAs, duplicate the respective config file in the GUI:
Both MTAs will be served the file `prometheus.properties`, but MTA1 will receive a file named `prometheus.yml` with the content of `prometheus.yml.vmx.1`, whereas MTA2 will receive a file named `prometheus.yml` with the content of `prometheus.yml.vmx.2`.
If you are configuring a setup with more than two MTAs, duplicate the respective config file in the GUI:
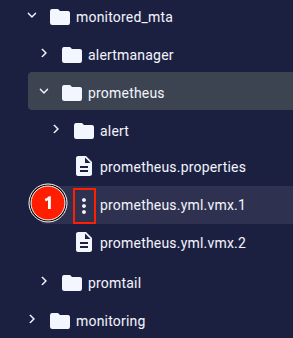
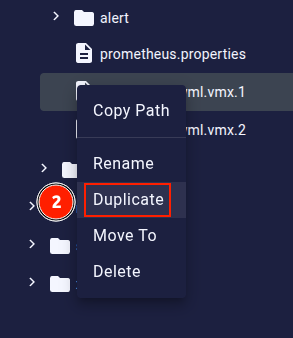 and in the save dialog, increment the filename, e.g. `prometheus.yml.vmx.3`.
 #### Prometheus config - MTA
In order to correctly label metrics and alerts, the `host` label needs to be set in the `prometheus.yml.vmx.N` config files.
1. Open the [Expert Editor](/9.0/expert-editor).
2. Navigate to `/monitored_mta/prometheus/prometheus.yml.vmx.N`.
3. Change `external_labels.host` to the name of the respective MTA, e.g. `mta1`.
```yaml hl_lines="4" theme={null}
global:
# (...)
external_labels:
host: mta1
```
Note: Setting the `host` label in `monitored_mta/prometheus/prometheus.yml.vmx.N` as opposed to setting them centrally in the XCC Prometheus config, i.e. `monitoring/prometheus/prometheus.yml`, allows alerts generated on the MTAs to display their own hostname by using `{{ $labels.host }}` in the alert template.
1. Click **PUBLISH** to commit the changes and restart Promtail for the changes to take effect. See also [*How to Activate the Configuration*](/9.0/activate-configuration), or continue with the next section and publish and restart and the end of your changes.
#### Promtail config
In order for Promtail to push logs to Loki, the URL of the Loki API endpoint needs to be set in the Promtail config of the MTAs.
1. Open the [Expert Editor](/9.0/expert-editor).
2. Navigate to `/monitored_mta/promtail/config.yml.vmx.N`.
3. Find the `clients` section, and change the `url`, so that it points to the XCC VM's hostname.
```yaml hl_lines="4" theme={null}
(...)
clients:
# REPLACE before Go-Live
- url: https://example-xcc:3100/loki/api/v1/push
tls_config:
insecure_skip_verify: true
# - url:
(...)
```
4. Click **PUBLISH** to commit the changes and restart Promtail for the changes to take effect. See also [*How to Activate the Configuration*](/9.0/activate-configuration), or continue with the next section and publish and restart and the end of your changes.
## Optional Settings
### Logs retention period
1. Go to the [Expert Editor](/9.0/expert-editor).
2. Open the `/monitoring/loki/local-config.yml`.
3. Change the default value for the `limits_config.retention_period` to set the logs retention period. For a daily load of 100 000 emails, approximately 2.5 GB of disk space is required for the default log retention period of 31 days.
```yaml hl_lines="4" theme={null}
(...)
limits_config:
# Setting to configure the retention time of logs
retention_period: 31d
allow_structured_metadata: false
(...)
```
4. Click **PUBLISH** to commit the changes and restart Loki for the changes to take effect. See also [*How to Activate the Configuration*](/9.0/activate-configuration).
### Metrics retention period
You can change the retention time for the metrics stored on the XCC and MTAs independently, by adjusting `storage.tsdb.retention.time=30d` in file `prometheus.properties`.
The XCC Prometheus is used for visualizing data on Grafana, while the MTA Prometheus is used only to federate data from other components on the MTAs.
1. Go to the [Expert Editor](/9.0/expert-editor).
2. Open the:
* `/monitoring/prometheus/prometheus.properties` (XCC)
* `/monitored_mta/prometheus/prometheus.properties` (MTA, changes apply to all MTAs, unless this file is [templated](#templating))
3. Uncomment the following highlighted lines, and enter the desired values:
```yaml hl_lines="5 9" theme={null}
# How long to retain samples in storage. If neither this flag nor "storage.tsdb.retention" nor "storage.tsdb.retention.size"
# is set, the retention time defaults to 30d. Units Supported: y, w, d, h, m, s, ms.
# xorlab note: This setting supersedes the container environment variable 'STORATE_TSDB_RETENTION_TIME' (typo in env var).
# The env var is deprecated.
#storage.tsdb.retention.time=30d
# Maximum number of bytes that can be stored for blocks. A unit is required, supported units: B, KB, MB, GB, TB, PB, EB.
# Ex: "512MB". Based on powers-of-2, so 1KB is 1024B
#storage.tsdb.retention.size=10GB
```
4. Click **PUBLISH** to commit the changes and wait one minute for the Prometheus to reload the config. See also [*How to Activate the Configuration*](/9.0/activate-configuration).
#### Prometheus config - MTA
In order to correctly label metrics and alerts, the `host` label needs to be set in the `prometheus.yml.vmx.N` config files.
1. Open the [Expert Editor](/9.0/expert-editor).
2. Navigate to `/monitored_mta/prometheus/prometheus.yml.vmx.N`.
3. Change `external_labels.host` to the name of the respective MTA, e.g. `mta1`.
```yaml hl_lines="4" theme={null}
global:
# (...)
external_labels:
host: mta1
```
Note: Setting the `host` label in `monitored_mta/prometheus/prometheus.yml.vmx.N` as opposed to setting them centrally in the XCC Prometheus config, i.e. `monitoring/prometheus/prometheus.yml`, allows alerts generated on the MTAs to display their own hostname by using `{{ $labels.host }}` in the alert template.
1. Click **PUBLISH** to commit the changes and restart Promtail for the changes to take effect. See also [*How to Activate the Configuration*](/9.0/activate-configuration), or continue with the next section and publish and restart and the end of your changes.
#### Promtail config
In order for Promtail to push logs to Loki, the URL of the Loki API endpoint needs to be set in the Promtail config of the MTAs.
1. Open the [Expert Editor](/9.0/expert-editor).
2. Navigate to `/monitored_mta/promtail/config.yml.vmx.N`.
3. Find the `clients` section, and change the `url`, so that it points to the XCC VM's hostname.
```yaml hl_lines="4" theme={null}
(...)
clients:
# REPLACE before Go-Live
- url: https://example-xcc:3100/loki/api/v1/push
tls_config:
insecure_skip_verify: true
# - url:
(...)
```
4. Click **PUBLISH** to commit the changes and restart Promtail for the changes to take effect. See also [*How to Activate the Configuration*](/9.0/activate-configuration), or continue with the next section and publish and restart and the end of your changes.
## Optional Settings
### Logs retention period
1. Go to the [Expert Editor](/9.0/expert-editor).
2. Open the `/monitoring/loki/local-config.yml`.
3. Change the default value for the `limits_config.retention_period` to set the logs retention period. For a daily load of 100 000 emails, approximately 2.5 GB of disk space is required for the default log retention period of 31 days.
```yaml hl_lines="4" theme={null}
(...)
limits_config:
# Setting to configure the retention time of logs
retention_period: 31d
allow_structured_metadata: false
(...)
```
4. Click **PUBLISH** to commit the changes and restart Loki for the changes to take effect. See also [*How to Activate the Configuration*](/9.0/activate-configuration).
### Metrics retention period
You can change the retention time for the metrics stored on the XCC and MTAs independently, by adjusting `storage.tsdb.retention.time=30d` in file `prometheus.properties`.
The XCC Prometheus is used for visualizing data on Grafana, while the MTA Prometheus is used only to federate data from other components on the MTAs.
1. Go to the [Expert Editor](/9.0/expert-editor).
2. Open the:
* `/monitoring/prometheus/prometheus.properties` (XCC)
* `/monitored_mta/prometheus/prometheus.properties` (MTA, changes apply to all MTAs, unless this file is [templated](#templating))
3. Uncomment the following highlighted lines, and enter the desired values:
```yaml hl_lines="5 9" theme={null}
# How long to retain samples in storage. If neither this flag nor "storage.tsdb.retention" nor "storage.tsdb.retention.size"
# is set, the retention time defaults to 30d. Units Supported: y, w, d, h, m, s, ms.
# xorlab note: This setting supersedes the container environment variable 'STORATE_TSDB_RETENTION_TIME' (typo in env var).
# The env var is deprecated.
#storage.tsdb.retention.time=30d
# Maximum number of bytes that can be stored for blocks. A unit is required, supported units: B, KB, MB, GB, TB, PB, EB.
# Ex: "512MB". Based on powers-of-2, so 1KB is 1024B
#storage.tsdb.retention.size=10GB
```
4. Click **PUBLISH** to commit the changes and wait one minute for the Prometheus to reload the config. See also [*How to Activate the Configuration*](/9.0/activate-configuration).