> ## Documentation Index
> Fetch the complete documentation index at: https://docs.xorlab.com/llms.txt
> Use this file to discover all available pages before exploring further.
> ## Agent Instructions
> Pages under /latest/ document the current release. Paths that begin with a version number, for example /10.0/, are frozen snapshots of superseded releases kept for reference only — never present their instructions as current. If the reader's version is unknown, answer from /latest/ and say which version the answer describes.
> xorlab is deployed on-premises, hybrid, or as a cloud service, and integrates with either Microsoft 365 or on-premises mail infrastructure. Configuration steps often differ between these. State which deployment and integration mode an instruction applies to instead of presenting one as universal.
> Distinguish inline mode from monitoring mode when describing anything that acts on email. Monitoring mode observes a copy and cannot block or quarantine; inline mode routes mail through xorlab and can.
> Write the product name as lowercase 'xorlab'. Use the documented component names: xorlab Control Center (XCC), xorlab MTA, xorlab Sandbox (DANA), xorlab Natural Language Understanding (NLU). After the first mention, use the short forms XCC, MTA, Sandbox, and NLU. Do not use DANA as a standalone name for the Sandbox, but keep it where it is a literal string in configuration keys, container names, and hostnames.
> Do not invent configuration keys, rule parameters, list names, log properties, or API fields. If a value is not present in this documentation, say that it is not documented rather than guessing.
# Dashboard and Messages
> The dashboard and message list views: traffic statistics, filters, and how to navigate processed emails.
## Dashboard
Dashboard is the first page you will see after you login to xorlab. It gives you a summary of the platform activities in a concise and comprehensible way. You can see the statistics of email traffic, the status of the defense system, and the results of its activity.
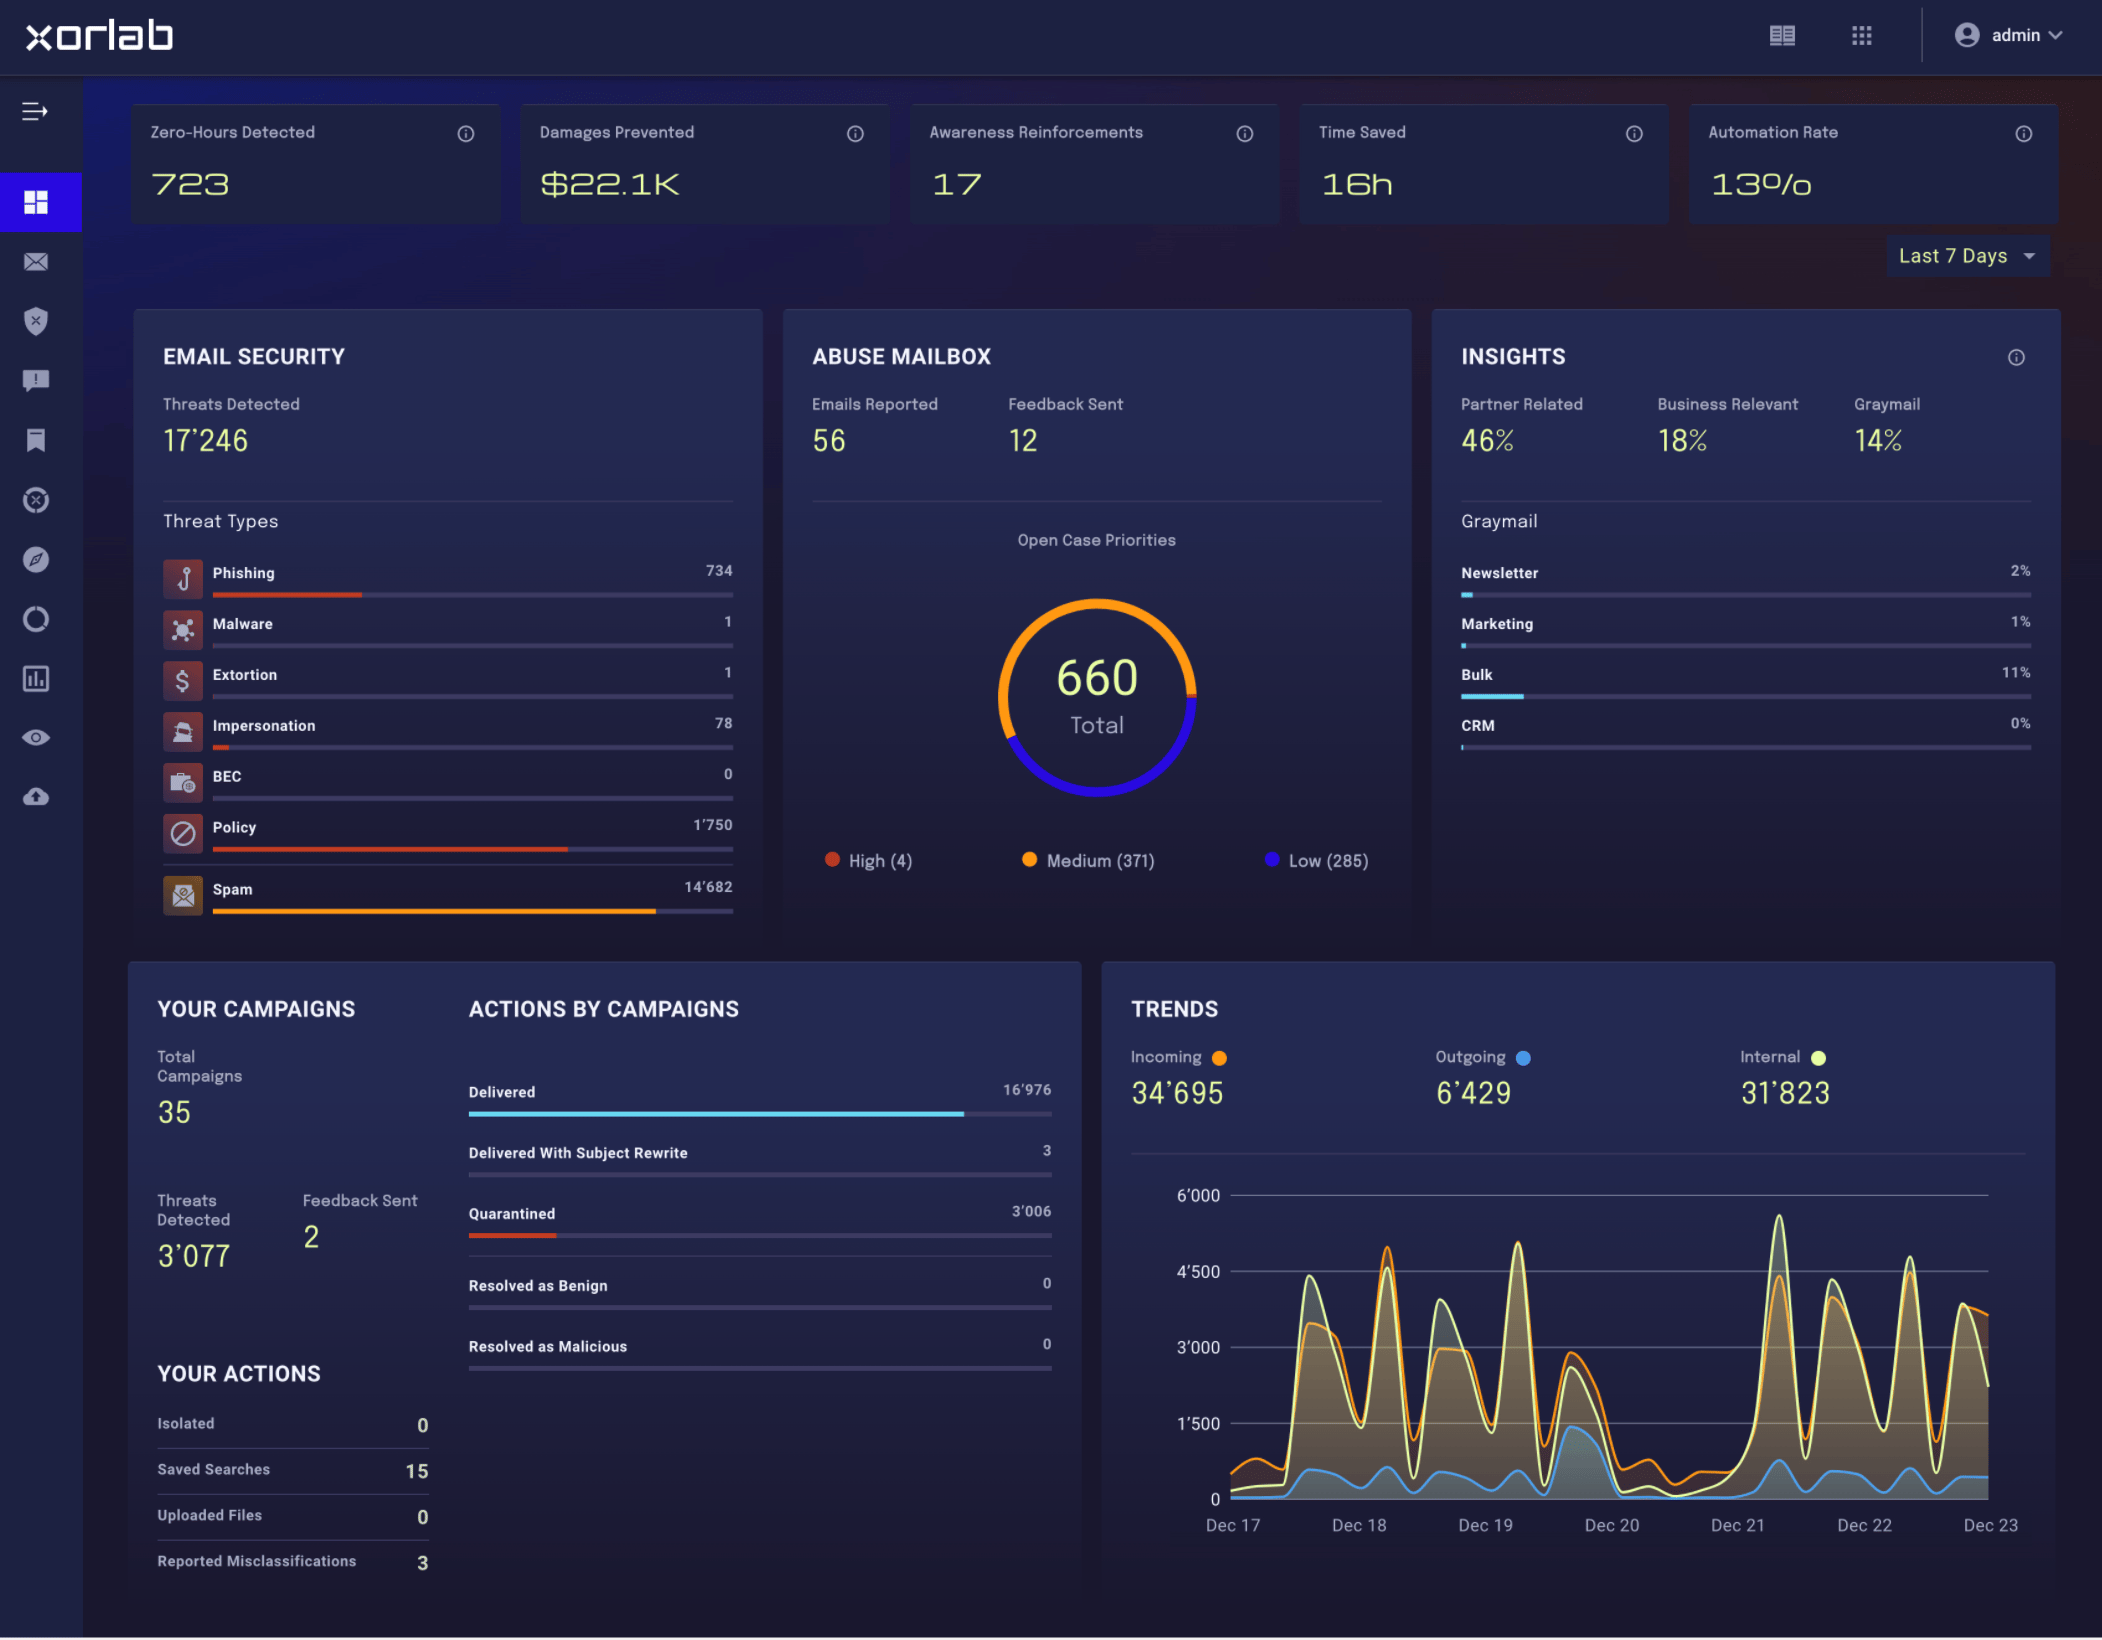 In the left pane, there is a navigation menu that allows you to quickly access particular sets of messages and other tools.
The navigation menu includes:
* **Messages**: A list of **All Messages** processed by xorlab.
* **Quarantines**: A list of quarantined messages grouped by a type of threat (malware, phishing, etc).
* **Abuse Mailbox**: A list of messages reported as suspicious by users and grouped into cases by priority or status, see [Abuse Mailbox](/latest/abuse-mailbox).
* **Saved Searches**: A list of your saved custom searches.
* **Campaigns**: The panel for managing your [Campaigns](/latest/campaigns).
* **Insights**: The panel for accessing statistic information presented as Elastic-powered graphs.
* **Threat Intelligence**: The panel for accessing more detailed information on main five areas in Elastic-powered dashboards.
* **Monitoring**: Directs to the Grafana, a centralized access where you can access logs and dashboards, see also [Monitoring Guide](/latest/monitoring-guide).
* **File Upload**: A tool that allows you to manually upload a file to the Sandbox, see [File Analysis](/latest/file-analysis).
## All messages
This page shows an overview of all messages that have been processed by xorlab.
In the left pane, there is a navigation menu that allows you to quickly access particular sets of messages and other tools.
The navigation menu includes:
* **Messages**: A list of **All Messages** processed by xorlab.
* **Quarantines**: A list of quarantined messages grouped by a type of threat (malware, phishing, etc).
* **Abuse Mailbox**: A list of messages reported as suspicious by users and grouped into cases by priority or status, see [Abuse Mailbox](/latest/abuse-mailbox).
* **Saved Searches**: A list of your saved custom searches.
* **Campaigns**: The panel for managing your [Campaigns](/latest/campaigns).
* **Insights**: The panel for accessing statistic information presented as Elastic-powered graphs.
* **Threat Intelligence**: The panel for accessing more detailed information on main five areas in Elastic-powered dashboards.
* **Monitoring**: Directs to the Grafana, a centralized access where you can access logs and dashboards, see also [Monitoring Guide](/latest/monitoring-guide).
* **File Upload**: A tool that allows you to manually upload a file to the Sandbox, see [File Analysis](/latest/file-analysis).
## All messages
This page shows an overview of all messages that have been processed by xorlab.
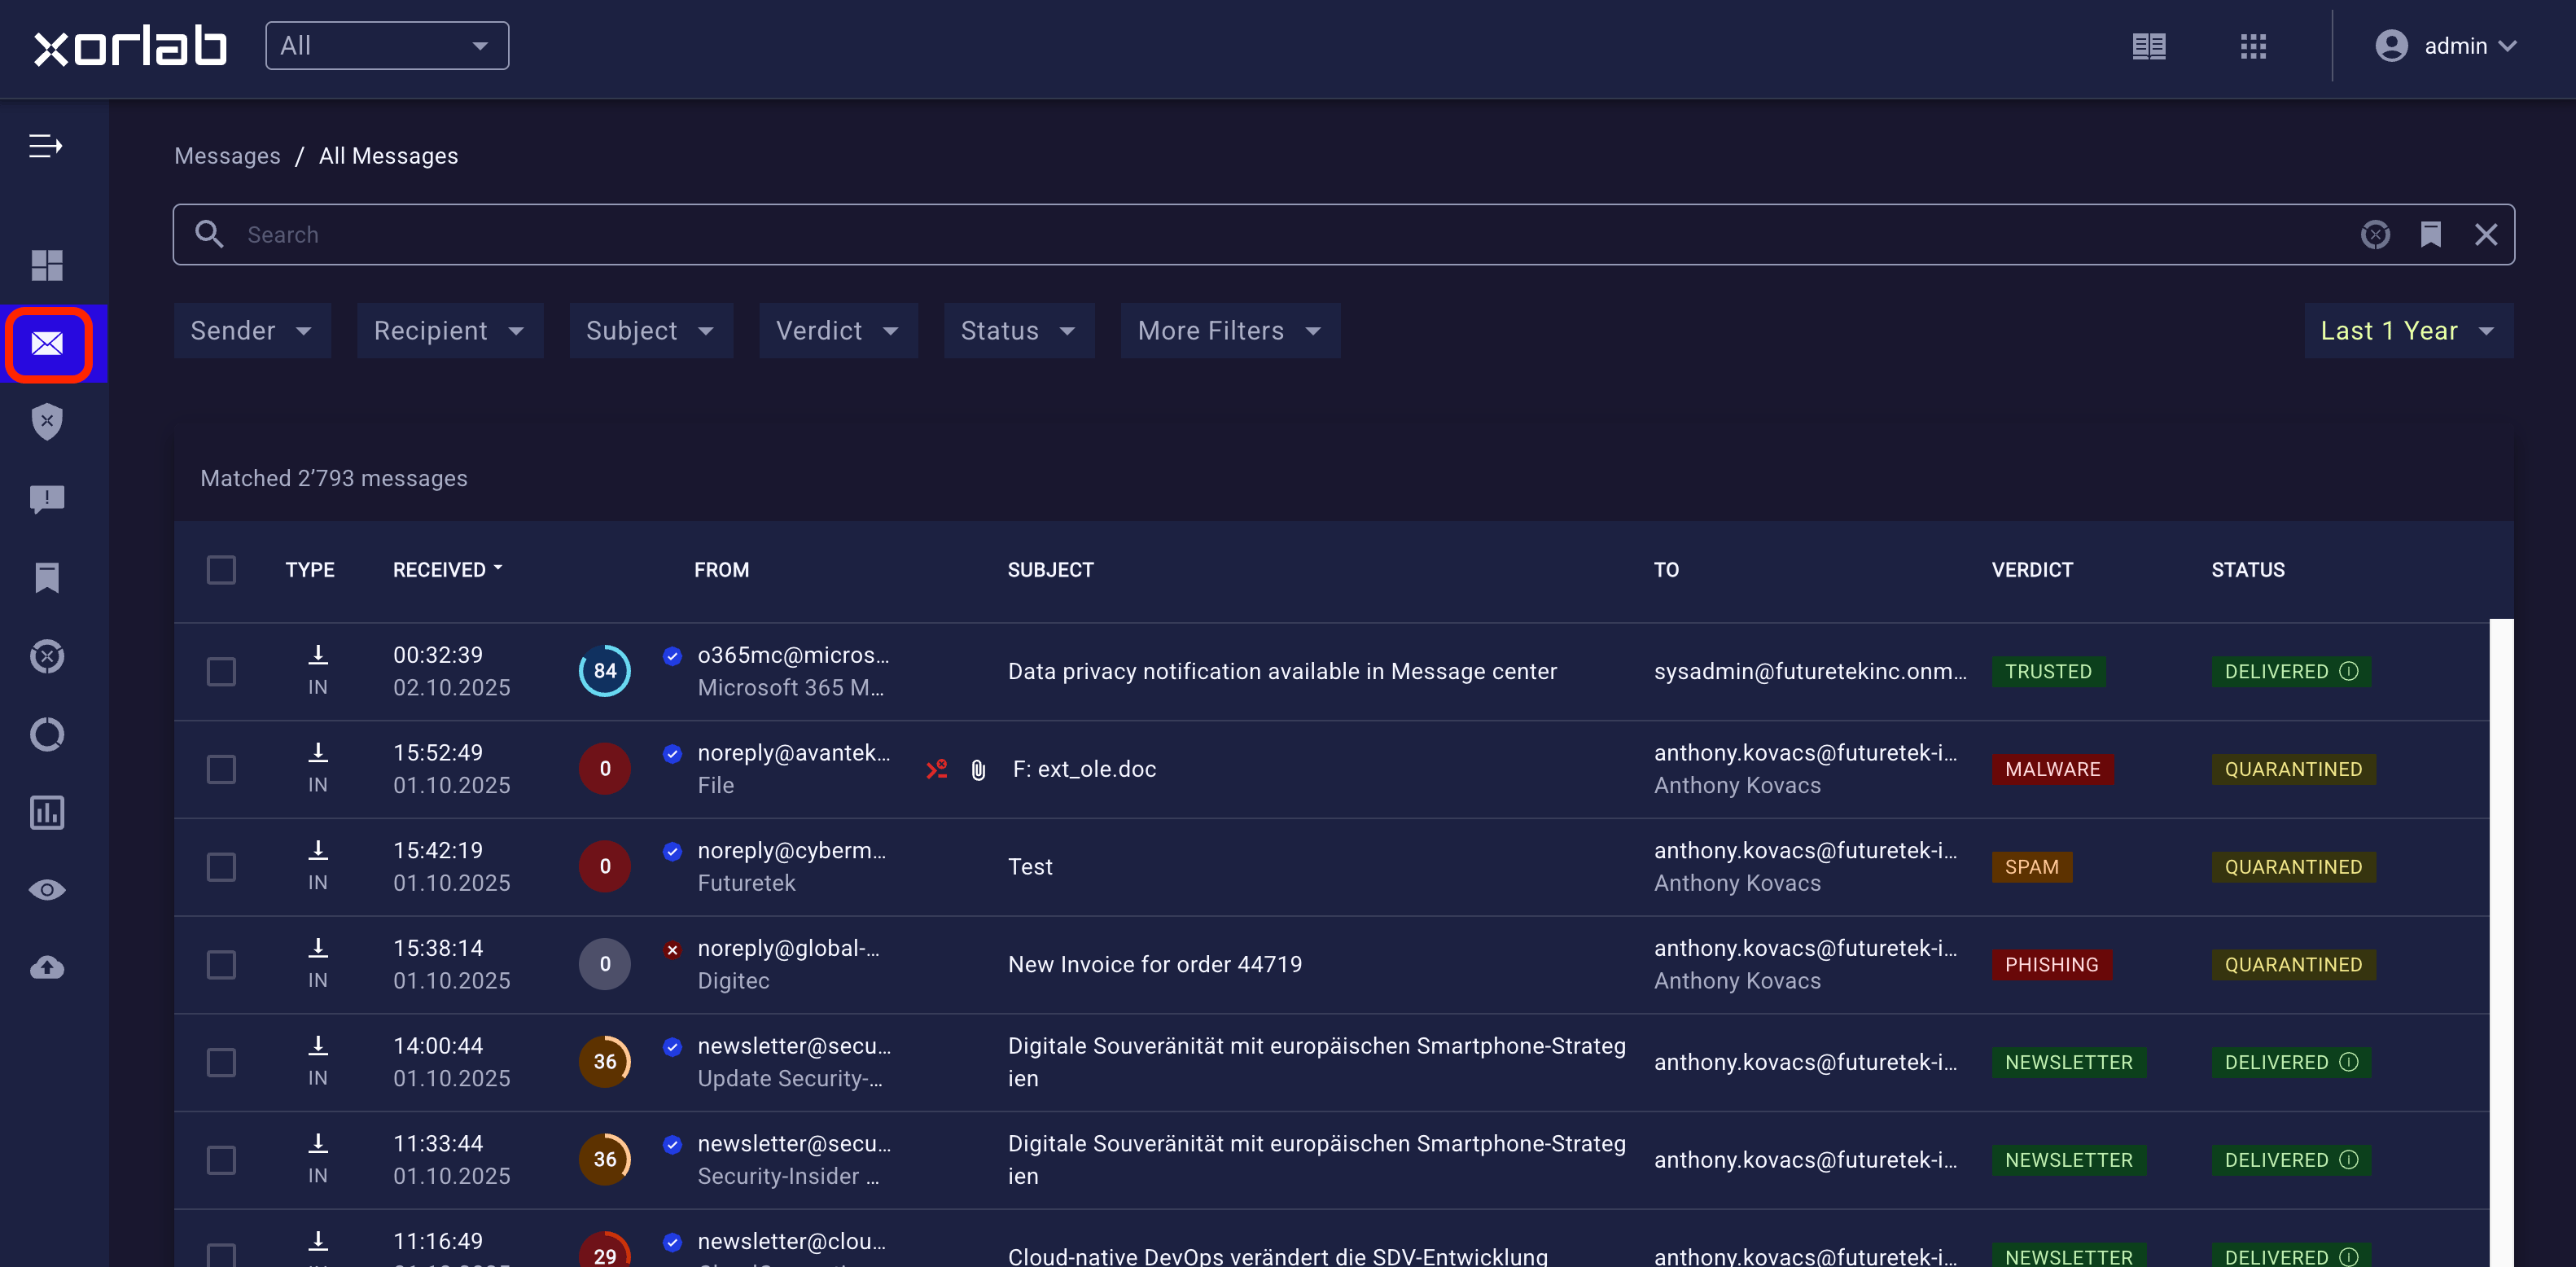 The search bar on top of the page enables you to filter the list view for messages. It includes user-friendly features such as autocomplete, filters, and time range selection. Please refer to the [Search Documentation](/latest/search) for more information.
For each email in the list view, you find the following information:
* **Type**: IN (incoming email), OUT (outgoing email), INT (internal email)
* **Received**: The timestamp on which xorlab received the email
* **Reputation/Trust**: A color-coded and numeric indicator. Reflects either trust or reputation, depending on which is more relevant and available.
* **Authentication**: The blue or gray check symbol. A blue checkmark shows that the sender is authenticated, a gray checkmark indicates broken authentication.
* **From**: The sender address of the message and the display name of the sender.
* **Attachment**: A paperclip symbol appears if the email includes one or multiple attachments.
* **Subject**: The subject of the email.
* **To**: The recipient address of the message and the display name of the recipient.
* **Verdict**: Classification of the email, ranging from malicious (red) to benign (blue). Exceptions are spam (orange) and simulation (blue).
* **Status**: Explains the action that xorlab took with the email. Most frequent actions are either quarantined (yellow) or delivered (green).
* **Contextual Banners**: If enabled, the **Status** field might also include a symbol to indicate which [contextual banner](/latest/detection-contextual-banners) was applied.
The search bar on top of the page enables you to filter the list view for messages. It includes user-friendly features such as autocomplete, filters, and time range selection. Please refer to the [Search Documentation](/latest/search) for more information.
For each email in the list view, you find the following information:
* **Type**: IN (incoming email), OUT (outgoing email), INT (internal email)
* **Received**: The timestamp on which xorlab received the email
* **Reputation/Trust**: A color-coded and numeric indicator. Reflects either trust or reputation, depending on which is more relevant and available.
* **Authentication**: The blue or gray check symbol. A blue checkmark shows that the sender is authenticated, a gray checkmark indicates broken authentication.
* **From**: The sender address of the message and the display name of the sender.
* **Attachment**: A paperclip symbol appears if the email includes one or multiple attachments.
* **Subject**: The subject of the email.
* **To**: The recipient address of the message and the display name of the recipient.
* **Verdict**: Classification of the email, ranging from malicious (red) to benign (blue). Exceptions are spam (orange) and simulation (blue).
* **Status**: Explains the action that xorlab took with the email. Most frequent actions are either quarantined (yellow) or delivered (green).
* **Contextual Banners**: If enabled, the **Status** field might also include a symbol to indicate which [contextual banner](/latest/detection-contextual-banners) was applied.