

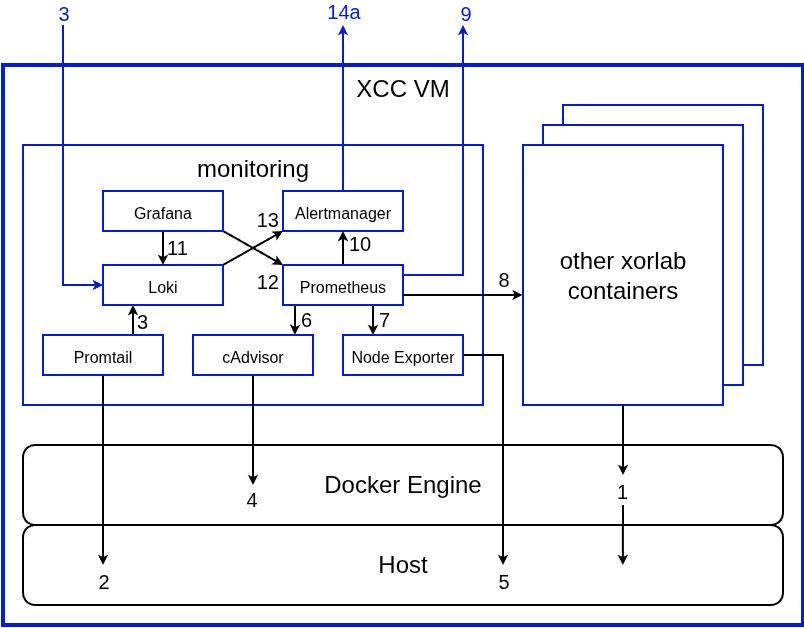
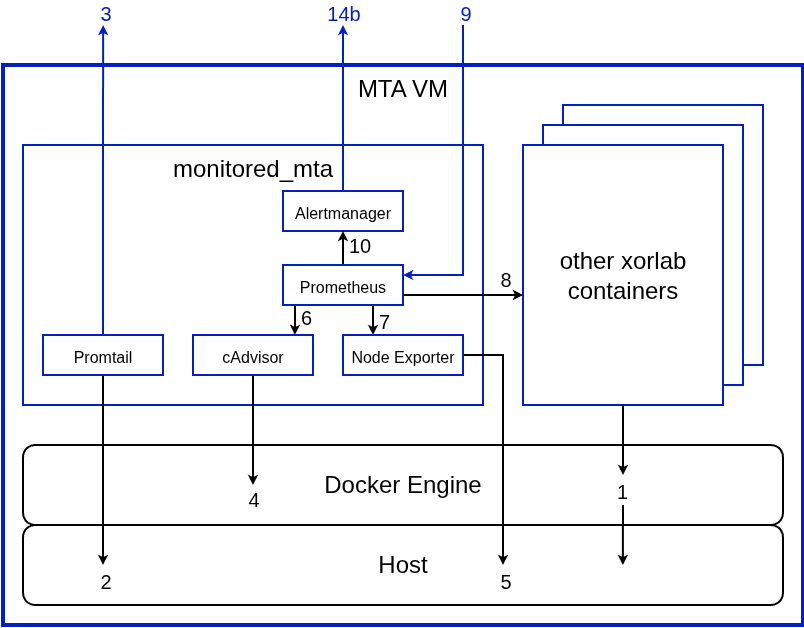
monitoring on the XCC VM (/etc/xorlab/monitoring) and monitored_mta on the MTA VMs (/etc/xorlab/monitored_mta), collect metrics and logs, and offer the option to send alerts based on those metrics/logs to configured receivers. They include the following components:
- Node Exporter to produce host metrics.
- cAdvisor to produce container metrics.
- Prometheus to collect and store metrics.
- Promtail to collect, process, and push logs to Loki.
- Loki to store logs (1)
- Alertmanager to route alerts to various consumers, e.g., via email, Slack, webhooks, etc.
- Grafana to present the metrics and logs on Dashboards, to search system logs and metrics from all VMs with queries, and check alerts. (2)
- Loki is only part of the XCC
monitoringstack and not present on the MTAs. - Grafana is only part of the XCC
monitoringstack and not present on the MTAs.
- Overview
- XCC detailed
- MTA detailed
Logs
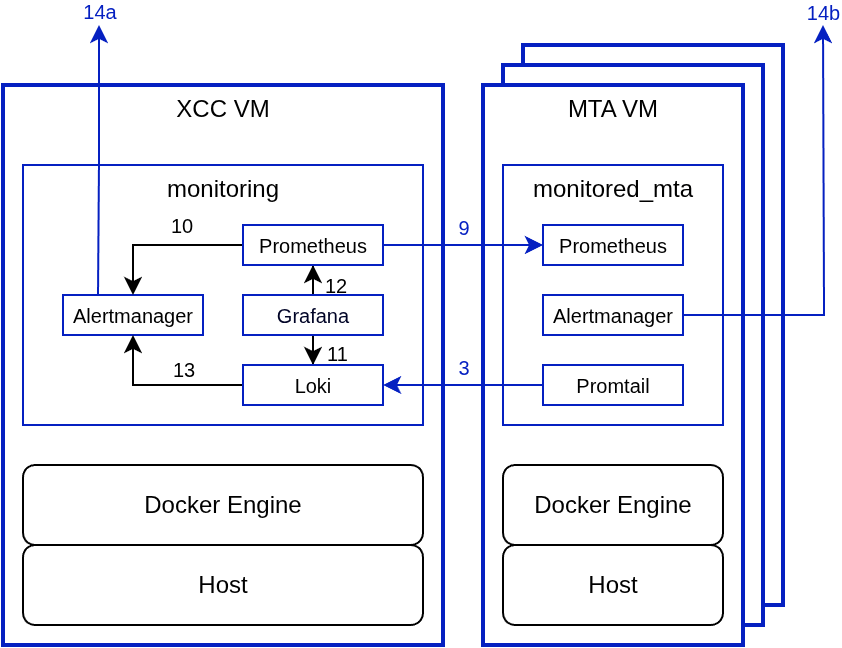
All logs written by Docker containers tostdout / stderr are captured by the Docker engine (1) and written to files on the host, where they are parsed by Promtail (2), which pushes the logs to Loki (3). Logs can then be searched and displayed in Grafana (11). Loki can also create alerts based on regular expressions evaluated against these logs and forward these alerts to Alertmanager (13).
Metrics
Prometheus collects metrics from xorlab containers (8), the Docker engine via cAdvisor (6), and the host via Node Exporter (7). All MTA metrics are first collected by the MTA Prometheus and then federated by the XCC Prometheus (9). Metrics can then be visualized on Grafana.Alerts
Alerts based on metrics are created by Prometheus and then forwarded by Alertmanager to the configured receivers. There are two ways to set up alerting:- Alerts for both the MTAs and XCC can be generated centrally on XCC (14a). This is easier to configure but creates a single point of failure for alerting on the XCC VM.
- Alerts for MTAs and XCC can be generated on all VMs separately (14a + 14b), this is more resilient and the recommended configuration.