> ## Documentation Index
> Fetch the complete documentation index at: https://docs.xorlab.com/llms.txt
> Use this file to discover all available pages before exploring further.
> ## Agent Instructions
> Pages under /latest/ document the current release. Paths that begin with a version number, for example /10.0/, are frozen snapshots of superseded releases kept for reference only — never present their instructions as current. If the reader's version is unknown, answer from /latest/ and say which version the answer describes.
> xorlab is deployed on-premises, hybrid, or as a cloud service, and integrates with either Microsoft 365 or on-premises mail infrastructure. Configuration steps often differ between these. State which deployment and integration mode an instruction applies to instead of presenting one as universal.
> Distinguish inline mode from monitoring mode when describing anything that acts on email. Monitoring mode observes a copy and cannot block or quarantine; inline mode routes mail through xorlab and can.
> Write the product name as lowercase 'xorlab'. Use the documented component names: xorlab Control Center (XCC), xorlab MTA, xorlab Sandbox (DANA), xorlab Natural Language Understanding (NLU). After the first mention, use the short forms XCC, MTA, Sandbox, and NLU. Do not use DANA as a standalone name for the Sandbox, but keep it where it is a literal string in configuration keys, container names, and hostnames.
> Do not invent configuration keys, rule parameters, list names, log properties, or API fields. If a value is not present in this documentation, say that it is not documented rather than guessing.
# Operation Reference
> Component architecture, CLI commands like restart and reboot procedures, and where the log files live.
## xorlab Security Platform architecture
Every xorlab Security Platform component (Sandbox, MTA, and XCC) comprises a set of Docker containers which have different responsibilities. MTA and XCC components are delivered to on-prem customers as separate VMs. xorlab Cloud (xCloud) and the xorlab Sandbox are components in the SaaS infrastructure that are needed by our platform. In rare cases, the Sandbox is run on-prem.
The following picture shows the most important containers, their dependencies, and a typical mail flow:
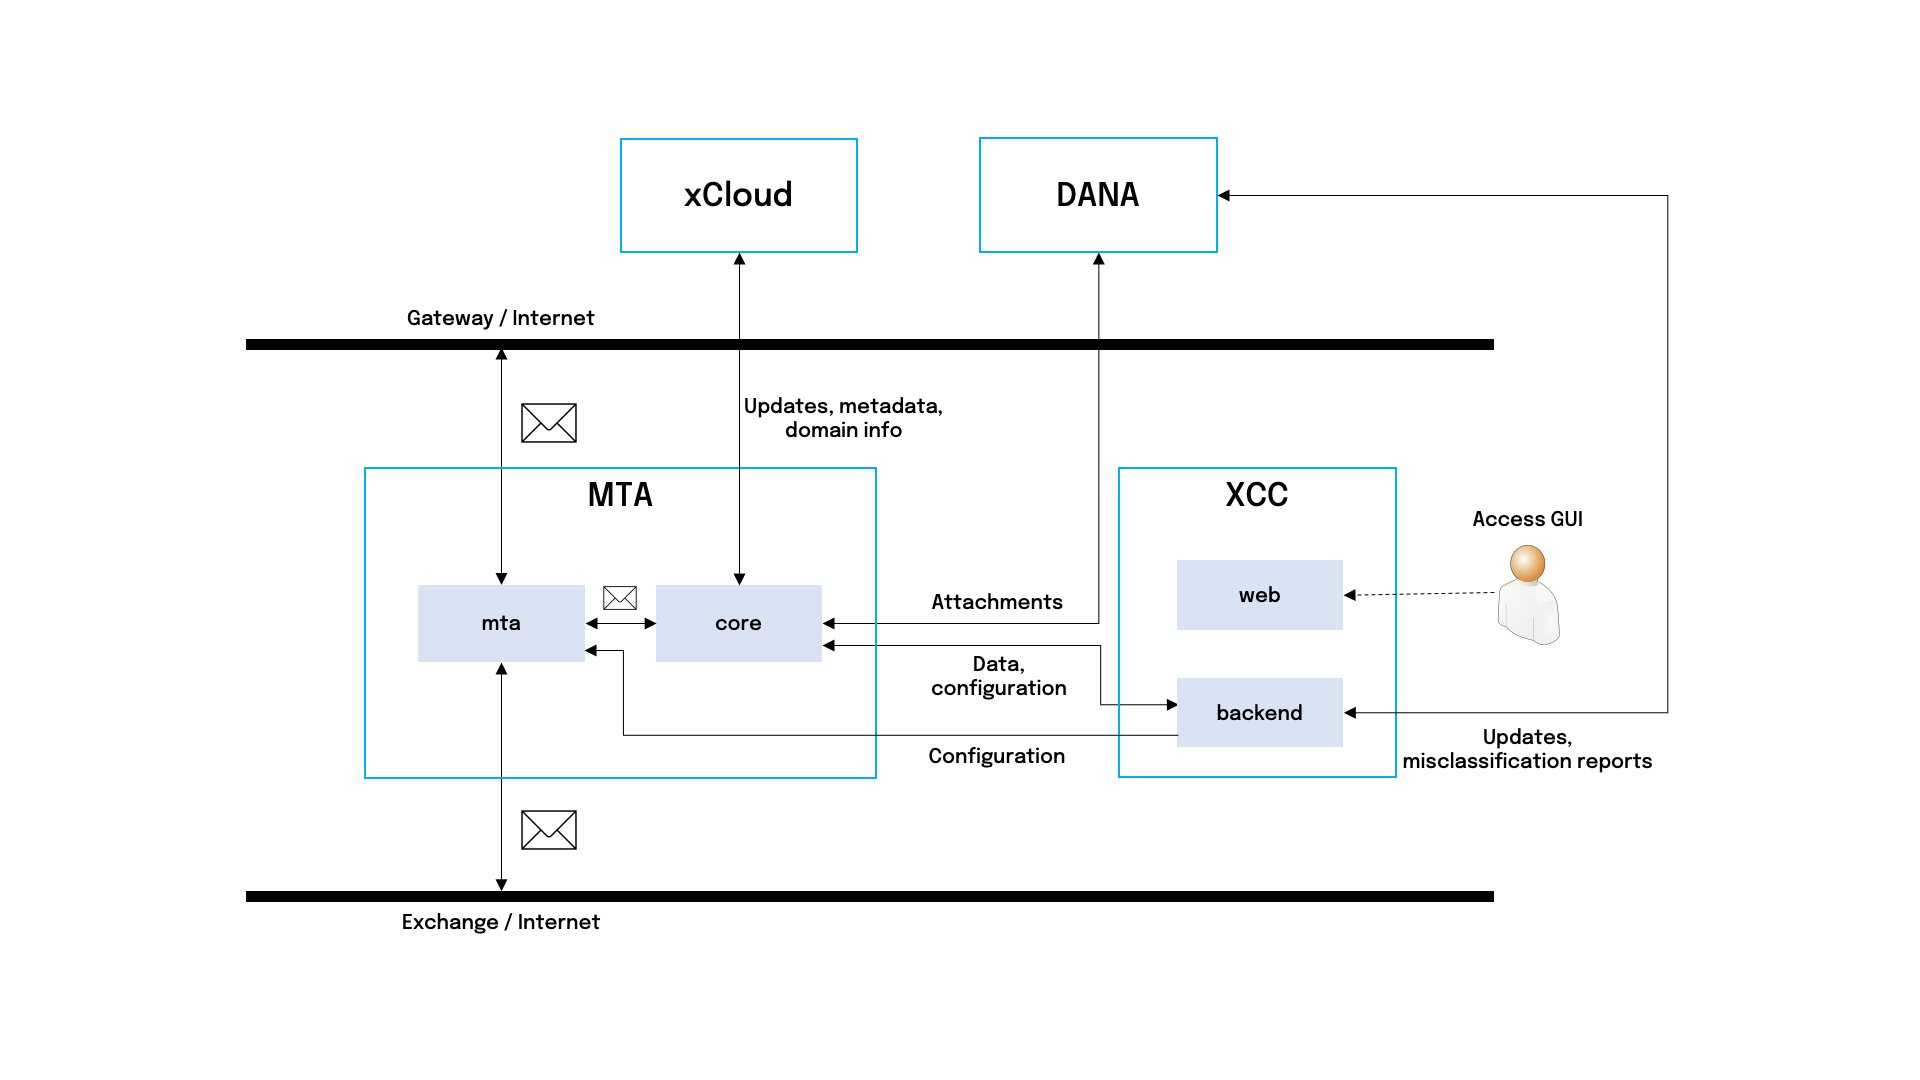 *Mail flow, containers and their dependencies in xorlab Security Platform (not exhaustive)*
Note that this is not an exhaustive list of dependencies. For all inter-component dependencies, full network traffic information, and other details regarding data flow from/to xorlab and within the platform, please see [Network Guide](/latest/network-guide).
The mail flow can be described in the following steps:
1. An email arrives at the MTA (xorlab Mail Transfer Agent) component using SMTP and is received by the `mta` container (basically, a postfix mail server).
2. The `mta` container forwards the email—still using SMTP—to the `core` container. If this transmission fails—e.g., because `core` is not ready to process the email—the email will be deferred by core, and you should see the following alert: `Emails Older Than 100 Seconds Stuck In the Deferred Queue`. `core` then performs a static analysis of the message. Depending on the settings and the message itself, the message attachments can additionally be scanned by sending them to the xorlab Sandbox (DANA). When the Sandbox scan is done, the email will be shown in **Messages → Pending** in the web interface.
3. The analysis results are published to the XCC component, where the results are persisted in a database and accessible through the XCC web interface. If the result publishing fails, you will receive the following alert: `Core System Test Failed`, with the description containing the name of the failing test—here, `ResultPublishSystemTest`.
4. If the message is allowed to be delivered, the `core` container hands it over back to the `mta` container for sending to the recipient. As in step #2, errors will trigger the following alert: `Emails Older Than 100 Seconds Stuck In the Deferred Queue`.
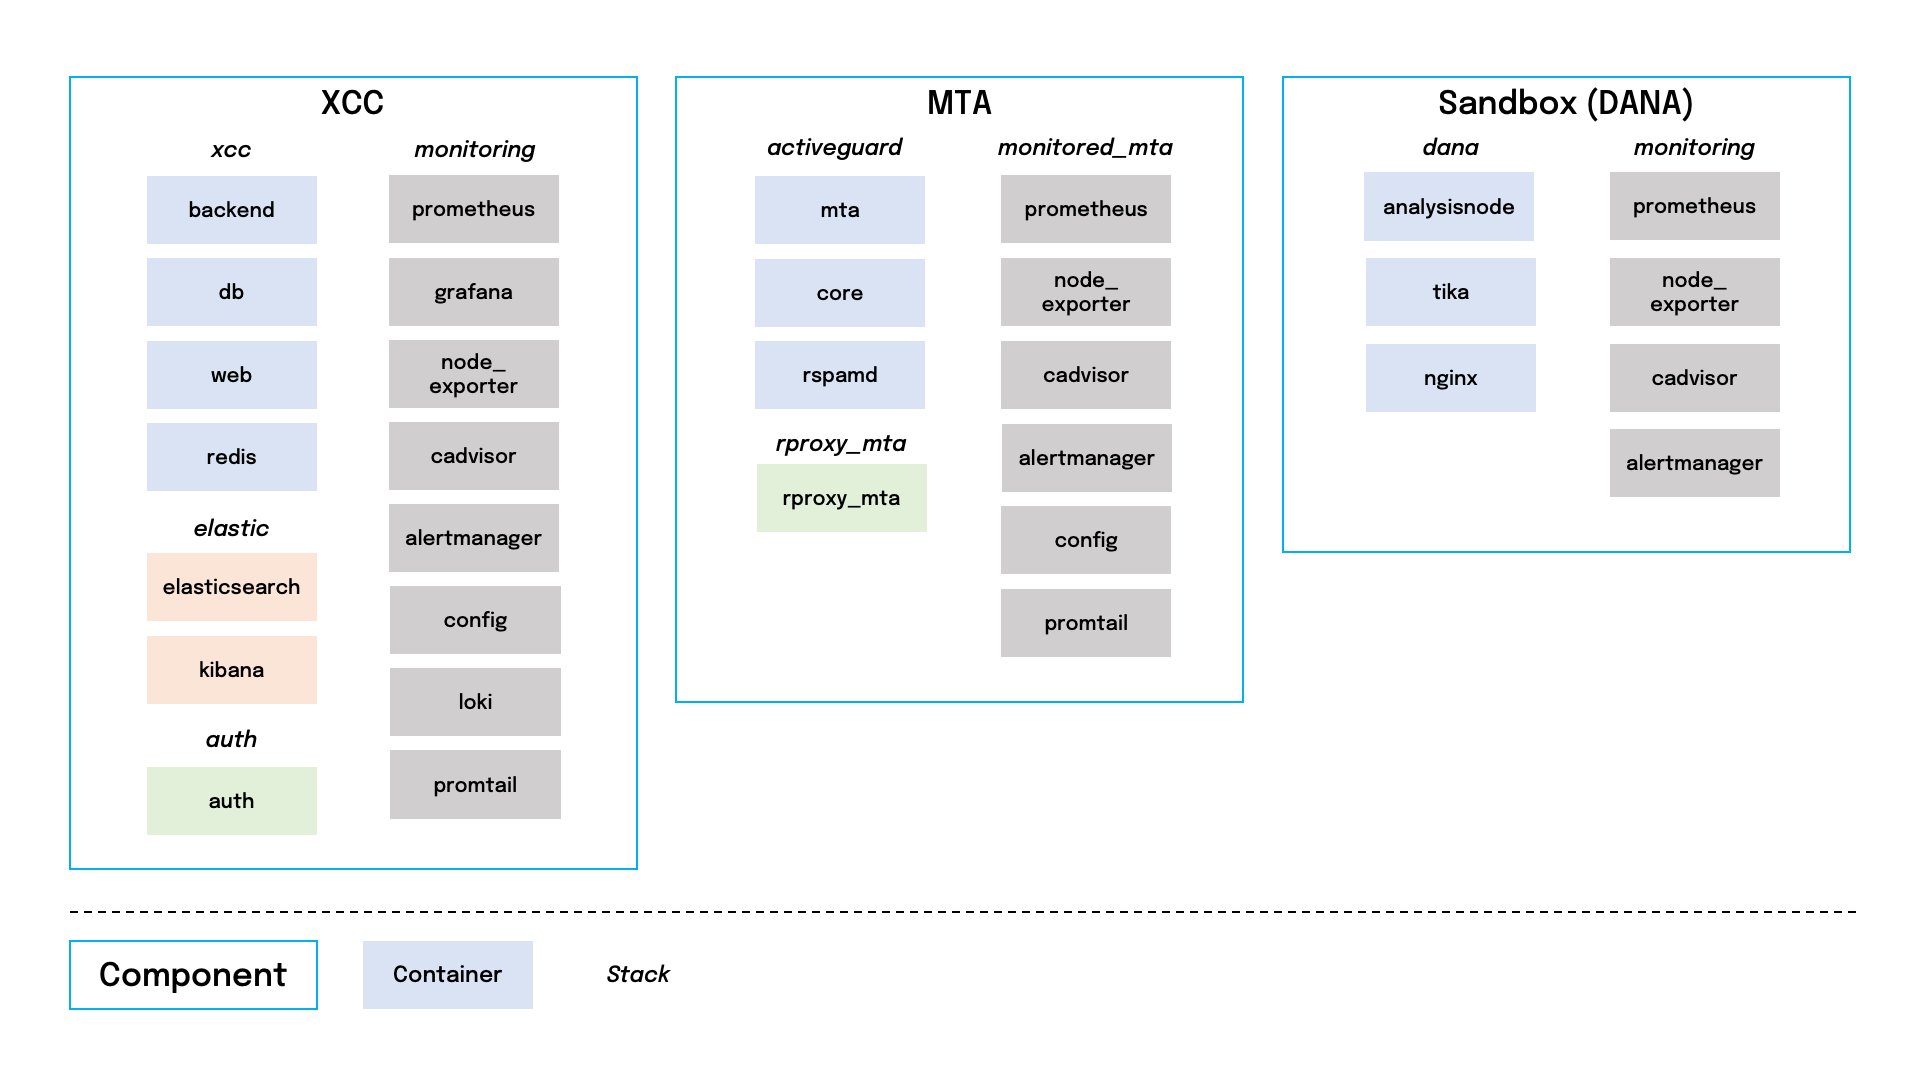
Generally, all containers are grouped into stacks. You can find all containers with their respective stacks in the following picture. Based on the stack and container name, you can later derive the location of the container log files on the host, e.g., `xcc_backend`.
*Mail flow, containers and their dependencies in xorlab Security Platform (not exhaustive)*
Note that this is not an exhaustive list of dependencies. For all inter-component dependencies, full network traffic information, and other details regarding data flow from/to xorlab and within the platform, please see [Network Guide](/latest/network-guide).
The mail flow can be described in the following steps:
1. An email arrives at the MTA (xorlab Mail Transfer Agent) component using SMTP and is received by the `mta` container (basically, a postfix mail server).
2. The `mta` container forwards the email—still using SMTP—to the `core` container. If this transmission fails—e.g., because `core` is not ready to process the email—the email will be deferred by core, and you should see the following alert: `Emails Older Than 100 Seconds Stuck In the Deferred Queue`. `core` then performs a static analysis of the message. Depending on the settings and the message itself, the message attachments can additionally be scanned by sending them to the xorlab Sandbox (DANA). When the Sandbox scan is done, the email will be shown in **Messages → Pending** in the web interface.
3. The analysis results are published to the XCC component, where the results are persisted in a database and accessible through the XCC web interface. If the result publishing fails, you will receive the following alert: `Core System Test Failed`, with the description containing the name of the failing test—here, `ResultPublishSystemTest`.
4. If the message is allowed to be delivered, the `core` container hands it over back to the `mta` container for sending to the recipient. As in step #2, errors will trigger the following alert: `Emails Older Than 100 Seconds Stuck In the Deferred Queue`.
Generally, all containers are grouped into stacks. You can find all containers with their respective stacks in the following picture. Based on the stack and container name, you can later derive the location of the container log files on the host, e.g., `xcc_backend`.
 ## Container description
### MTA
| Container | Description |
| :----------- | :---------------------------------------------------------------------------------------------------------------------------------- |
| `core` | Email processing engine. Parses the email, applies rules and policies, classifies the email, and decides if it is legitimate or not |
| `mta` | Responsible for email routing. Accepts and forwards emails. Sends the emails to `core` for processing before forwarding them |
| `rspamd` | Spam detection module used by `core` |
| `rproxy_mta` | Reverse proxy for the MTA |
### XCC
| Container | Description |
| :-------------- | :-------------------------------------------------------------------------------------------------------------------------------------------------------------------- |
| `backend` | Heart of XCC. Provides the API for MTAs, maintains the configuration, computes the trust model, provides the web interface, etc. |
| `db` | Database for all email related data |
| `web` | Reverse proxy handling access to the `backend` API |
| `redis` | Fast, in-memory key-value pair data store |
| `elasticsearch` | Refines the data from `db` to support advanced data search and processing. Used internally to provide search in the web interface |
| `kibana` | Provides the dashboards accessible through the **Insights** menu |
| `auth` | Performs user authentication. Can integrate external systems through, for example, LDAP or SAML. Provides user and role information to the backend for access control |
### Sandbox (DANA)
| Container | Description |
| :------------- | :---------------------------------------------------------------------------- |
| `analysisnode` | Responsible for the Sandbox. Receives files and scans them in internal VMs |
| `tika` | Text processing engine. Extracts text from various documents and supports OCR |
| `nginx` | Reverse proxy handling access to the `analysisnode` API |
### Shared monitoring containers
| Container | Description |
| :-------------- | :----------------------------------------------------------------------------------------------------------------------------------------------------------------------------------------------------------------------------------------------------------------------------------------------------- |
| `prometheus` | Monitoring system and time series database: stores all monitoring metrics and applies the alert rules to see if an alert must be triggered. Additionally, Prometheus on XCC can collect the monitoring metrics from other Prometheus instances on MTAs and DANAs for a centralized view of all metrics |
| `grafana` | Data analytics and monitoring |
| `node_exporter` | Gathers metrics from the host (node) |
| `cadvisor` | Gathers Docker metrics |
| `alertmanager` | Collects and sends alerts to users |
| `config` | Pulls config from the config providers (`xcloud` for global and `xcc_backend` for local configuration) |
| `loki` | Log aggregation system for storing and querying logs |
| `promtail` | Sends the contents of local logs to the `loki` service |
## Start and stop
Generic procedure to start and stop stacks on the xorlab Security Platform components is performed within the stack folder and looks like this:
```shell theme={null}
## Execute inside the stack folder, e.g., for xcc:
cd /etc/xorlab/xcc
## Stop stack
docker compose down
## Start stack (starts all not running containers)
docker compose up -d
## Stop single container
docker compose stop
```
### MTA
Stop and start:
```shell theme={null}
cd /etc/xorlab/activeguard
# Stop activeguard stack; make sure to stop the core container first.
docker compose down
# Start it again
docker compose up -d
```
If you only want to restart the core container due to configuration changes, use the restart button in the MTA GUI.
### XCC
Stop and start:
```shell theme={null}
## The ordering is important
# Stop all stacks
cd /etc/xorlab/auth
docker compose down
cd /etc/xorlab/xcc
docker compose down
cd /etc/xorlab/elastic
docker compose down
# Start all stacks again
cd /etc/xorlab/elastic
docker compose up -d
cd /etc/xorlab/xcc
docker compose up -d
cd /etc/xorlab/auth
docker compose up -d
```
### Sandbox (DANA)
Stop and start:
```shell theme={null}
cd /etc/xorlab/dana
# Stop the Sandbox stack
docker compose down
# Start it again
docker compose up -d
```
Note that current dynamic scans will be lost and there will be no re-scan. To prevent this, make sure the queue is empty before stopping.
## Reboot
To reboot a component, execute the following command:
```shell theme={null}
sudo reboot
```
* **XCC**: can be rebooted at any time.
* **MTA**: stop the `ag` stack before reboot.
Emails that are being processed when a shutdown command is issued, will not be lost but are delayed until the MTA is fully operational again. To avoid this delay, you can block new incoming SMTP connections using the `iptables` commands described in the [Email queue](#stopping-and-resuming-accepting-emails-by-mta) section below. The inserted firewall block, `iptables -I`, will be cleared by a reboot or the corresponding `iptables -D` command. It is strongly recommended to only reboot one MTA at a time to ensure continuous email processing.
## Log files
Most xorlab Security Platform internal containers write log files to a standardized location:
```shell theme={null}
/var/log/xorlab///
```
For example:
* `/var/log/xorlab/xcc/backend/`
* `/var/log/xorlab/auth/auth/`
* `/var/log/xorlab/activeguard/core/`
* `/var/log/xorlab/dana/analysisnode/`
The following log files are available:
```shell theme={null}
# Error log file
_err.log
# Verbose log (INFO/DEBUG)
.log
```
The most important container log files:
* backend: `xcc.log` and `xcc_err.log`
* auth: `auth.log` and `auth_err.log`
* core: `activeguard.log` and `activeguard_err.log`
* analysisnode: `analysisnode.log` and `analysisnode_err.log`
**Standard out**
The following containers do not have log files: `elasticsearch`, `kibana`, `db`, and all monitoring containers. For those, logs are written to the standard output which you can read by executing `docker compose logs ` inside the `/etc/xorlab/` folder.
## Email queue
The email queue sizes can be conveniently observed in the grafana monitoring dashboards. For more advanced email queue handling, connect to each MTA separately.
**List all queued emails:**
```shell theme={null}
docker exec -it ag_mta mailq
```
**Flush (resend) all queues:**
```shell theme={null}
docker exec -it ag_mta postqueue -f
```
**Requeue all queued emails:**
```shell theme={null}
docker exec -it ag_mta postsuper -r ALL
```
**Requeue vs. flush**
A **flush** is a lightweight operation where xorlab Security Platform will try to resend all queued emails.
A **requeue** will treat all queued emails as if they were completely new emails. This will re-apply all header checks, address rewrites, routing decisions, etc. If you use this when there are emails in the deferred queue that already passed through core, they will be sent again to core (which will cause the email to be shown twice in the XCC).
**Delete an email from the queue:**
```shell theme={null}
# Find the queue ID of the email that should be deleted
docker exec -it ag_mta mailq
# Replace with the queue ID of the actual email
docker exec -it ag_mta postsuper -d
```
**Delete all emails in a specific queue:**
```shell theme={null}
# Deletes all emails in the deferred queue. "deferred" can be replaced with other queue names like "incoming" or "active".
docker exec -it ag_mta postsuper -d ALL deferred
```
### Exporting an email from the queue to EML format
The email files of a particular queue—`active`, `incoming`, or `deferred`—are in the `/var/lib/docker/volumes/activeguard_mta_spool/_data/` directory on the MTAs. You must be root to access this folder (`sudo su`).
The email file in the queue directory will have the queue ID as a name (e.g., `9A2821FE2`). If you want to convert the email file to the EML format, you can use the following instructions:
1. Run
```shell theme={null}
docker exec -it ag_mta bash
```
2. Execute
```shell theme={null}
cd /var/spool/postfix/
```
3. Find the email file.
4. Run
```shell theme={null}
postcat -bh > /var/log/file_name.eml
```
5. Press Ctrl+D.
6. Now, you can find the EML file in the `/var/log/xorlab/activeguard/mta/` directory.
### Stopping and resuming accepting emails by MTA
Sometimes you might want to prevent an MTA from accepting emails because, for example, you would like to empty the MTA from messages before performing an update. In this case, use SSH and run the following command (port 25 is used here as an example):
```shell theme={null}
# block incoming emails on MTA (e.g., for maintenance) on port 25
sudo iptables -I DOCKER-USER -i eth0 -p tcp --dport 25 -m state --state NEW -j REJECT
```
where `eth0` is the interface name, which can be found, for example, with `ip -4 a`.
When you execute the command, wait one minute—or check in XCC for emails being processed—then shut down xorlab Security Platform.
After the maintenance, you can resume accepting emails:
```shell theme={null}
# accept incoming emails again on port 25
sudo iptables -D DOCKER-USER -i eth0 -p tcp --dport 25 -m state --state NEW -j REJECT
```
**Docker packet filtering**
To learn more, see the [Packet filtering and firewalls](https://docs.docker.com/engine/network/packet-filtering-firewalls/) and [Match the original IP and ports for requests](https://docs.docker.com/engine/network/packet-filtering-firewalls/#match-the-original-ip-and-ports-for-requests) from the official Docker Engine documentation.
## Container description
### MTA
| Container | Description |
| :----------- | :---------------------------------------------------------------------------------------------------------------------------------- |
| `core` | Email processing engine. Parses the email, applies rules and policies, classifies the email, and decides if it is legitimate or not |
| `mta` | Responsible for email routing. Accepts and forwards emails. Sends the emails to `core` for processing before forwarding them |
| `rspamd` | Spam detection module used by `core` |
| `rproxy_mta` | Reverse proxy for the MTA |
### XCC
| Container | Description |
| :-------------- | :-------------------------------------------------------------------------------------------------------------------------------------------------------------------- |
| `backend` | Heart of XCC. Provides the API for MTAs, maintains the configuration, computes the trust model, provides the web interface, etc. |
| `db` | Database for all email related data |
| `web` | Reverse proxy handling access to the `backend` API |
| `redis` | Fast, in-memory key-value pair data store |
| `elasticsearch` | Refines the data from `db` to support advanced data search and processing. Used internally to provide search in the web interface |
| `kibana` | Provides the dashboards accessible through the **Insights** menu |
| `auth` | Performs user authentication. Can integrate external systems through, for example, LDAP or SAML. Provides user and role information to the backend for access control |
### Sandbox (DANA)
| Container | Description |
| :------------- | :---------------------------------------------------------------------------- |
| `analysisnode` | Responsible for the Sandbox. Receives files and scans them in internal VMs |
| `tika` | Text processing engine. Extracts text from various documents and supports OCR |
| `nginx` | Reverse proxy handling access to the `analysisnode` API |
### Shared monitoring containers
| Container | Description |
| :-------------- | :----------------------------------------------------------------------------------------------------------------------------------------------------------------------------------------------------------------------------------------------------------------------------------------------------- |
| `prometheus` | Monitoring system and time series database: stores all monitoring metrics and applies the alert rules to see if an alert must be triggered. Additionally, Prometheus on XCC can collect the monitoring metrics from other Prometheus instances on MTAs and DANAs for a centralized view of all metrics |
| `grafana` | Data analytics and monitoring |
| `node_exporter` | Gathers metrics from the host (node) |
| `cadvisor` | Gathers Docker metrics |
| `alertmanager` | Collects and sends alerts to users |
| `config` | Pulls config from the config providers (`xcloud` for global and `xcc_backend` for local configuration) |
| `loki` | Log aggregation system for storing and querying logs |
| `promtail` | Sends the contents of local logs to the `loki` service |
## Start and stop
Generic procedure to start and stop stacks on the xorlab Security Platform components is performed within the stack folder and looks like this:
```shell theme={null}
## Execute inside the stack folder, e.g., for xcc:
cd /etc/xorlab/xcc
## Stop stack
docker compose down
## Start stack (starts all not running containers)
docker compose up -d
## Stop single container
docker compose stop
```
### MTA
Stop and start:
```shell theme={null}
cd /etc/xorlab/activeguard
# Stop activeguard stack; make sure to stop the core container first.
docker compose down
# Start it again
docker compose up -d
```
If you only want to restart the core container due to configuration changes, use the restart button in the MTA GUI.
### XCC
Stop and start:
```shell theme={null}
## The ordering is important
# Stop all stacks
cd /etc/xorlab/auth
docker compose down
cd /etc/xorlab/xcc
docker compose down
cd /etc/xorlab/elastic
docker compose down
# Start all stacks again
cd /etc/xorlab/elastic
docker compose up -d
cd /etc/xorlab/xcc
docker compose up -d
cd /etc/xorlab/auth
docker compose up -d
```
### Sandbox (DANA)
Stop and start:
```shell theme={null}
cd /etc/xorlab/dana
# Stop the Sandbox stack
docker compose down
# Start it again
docker compose up -d
```
Note that current dynamic scans will be lost and there will be no re-scan. To prevent this, make sure the queue is empty before stopping.
## Reboot
To reboot a component, execute the following command:
```shell theme={null}
sudo reboot
```
* **XCC**: can be rebooted at any time.
* **MTA**: stop the `ag` stack before reboot.
Emails that are being processed when a shutdown command is issued, will not be lost but are delayed until the MTA is fully operational again. To avoid this delay, you can block new incoming SMTP connections using the `iptables` commands described in the [Email queue](#stopping-and-resuming-accepting-emails-by-mta) section below. The inserted firewall block, `iptables -I`, will be cleared by a reboot or the corresponding `iptables -D` command. It is strongly recommended to only reboot one MTA at a time to ensure continuous email processing.
## Log files
Most xorlab Security Platform internal containers write log files to a standardized location:
```shell theme={null}
/var/log/xorlab///
```
For example:
* `/var/log/xorlab/xcc/backend/`
* `/var/log/xorlab/auth/auth/`
* `/var/log/xorlab/activeguard/core/`
* `/var/log/xorlab/dana/analysisnode/`
The following log files are available:
```shell theme={null}
# Error log file
_err.log
# Verbose log (INFO/DEBUG)
.log
```
The most important container log files:
* backend: `xcc.log` and `xcc_err.log`
* auth: `auth.log` and `auth_err.log`
* core: `activeguard.log` and `activeguard_err.log`
* analysisnode: `analysisnode.log` and `analysisnode_err.log`
**Standard out**
The following containers do not have log files: `elasticsearch`, `kibana`, `db`, and all monitoring containers. For those, logs are written to the standard output which you can read by executing `docker compose logs ` inside the `/etc/xorlab/` folder.
## Email queue
The email queue sizes can be conveniently observed in the grafana monitoring dashboards. For more advanced email queue handling, connect to each MTA separately.
**List all queued emails:**
```shell theme={null}
docker exec -it ag_mta mailq
```
**Flush (resend) all queues:**
```shell theme={null}
docker exec -it ag_mta postqueue -f
```
**Requeue all queued emails:**
```shell theme={null}
docker exec -it ag_mta postsuper -r ALL
```
**Requeue vs. flush**
A **flush** is a lightweight operation where xorlab Security Platform will try to resend all queued emails.
A **requeue** will treat all queued emails as if they were completely new emails. This will re-apply all header checks, address rewrites, routing decisions, etc. If you use this when there are emails in the deferred queue that already passed through core, they will be sent again to core (which will cause the email to be shown twice in the XCC).
**Delete an email from the queue:**
```shell theme={null}
# Find the queue ID of the email that should be deleted
docker exec -it ag_mta mailq
# Replace with the queue ID of the actual email
docker exec -it ag_mta postsuper -d
```
**Delete all emails in a specific queue:**
```shell theme={null}
# Deletes all emails in the deferred queue. "deferred" can be replaced with other queue names like "incoming" or "active".
docker exec -it ag_mta postsuper -d ALL deferred
```
### Exporting an email from the queue to EML format
The email files of a particular queue—`active`, `incoming`, or `deferred`—are in the `/var/lib/docker/volumes/activeguard_mta_spool/_data/` directory on the MTAs. You must be root to access this folder (`sudo su`).
The email file in the queue directory will have the queue ID as a name (e.g., `9A2821FE2`). If you want to convert the email file to the EML format, you can use the following instructions:
1. Run
```shell theme={null}
docker exec -it ag_mta bash
```
2. Execute
```shell theme={null}
cd /var/spool/postfix/
```
3. Find the email file.
4. Run
```shell theme={null}
postcat -bh > /var/log/file_name.eml
```
5. Press Ctrl+D.
6. Now, you can find the EML file in the `/var/log/xorlab/activeguard/mta/` directory.
### Stopping and resuming accepting emails by MTA
Sometimes you might want to prevent an MTA from accepting emails because, for example, you would like to empty the MTA from messages before performing an update. In this case, use SSH and run the following command (port 25 is used here as an example):
```shell theme={null}
# block incoming emails on MTA (e.g., for maintenance) on port 25
sudo iptables -I DOCKER-USER -i eth0 -p tcp --dport 25 -m state --state NEW -j REJECT
```
where `eth0` is the interface name, which can be found, for example, with `ip -4 a`.
When you execute the command, wait one minute—or check in XCC for emails being processed—then shut down xorlab Security Platform.
After the maintenance, you can resume accepting emails:
```shell theme={null}
# accept incoming emails again on port 25
sudo iptables -D DOCKER-USER -i eth0 -p tcp --dport 25 -m state --state NEW -j REJECT
```
**Docker packet filtering**
To learn more, see the [Packet filtering and firewalls](https://docs.docker.com/engine/network/packet-filtering-firewalls/) and [Match the original IP and ports for requests](https://docs.docker.com/engine/network/packet-filtering-firewalls/#match-the-original-ip-and-ports-for-requests) from the official Docker Engine documentation.