

Dashboard
Dashboard is the first page you will see after you login to xorlab. It gives you a summary of the platform activities in a concise and comprehensible way. You can see the statistics of email traffic, the status of the defense system, and the results of its activity.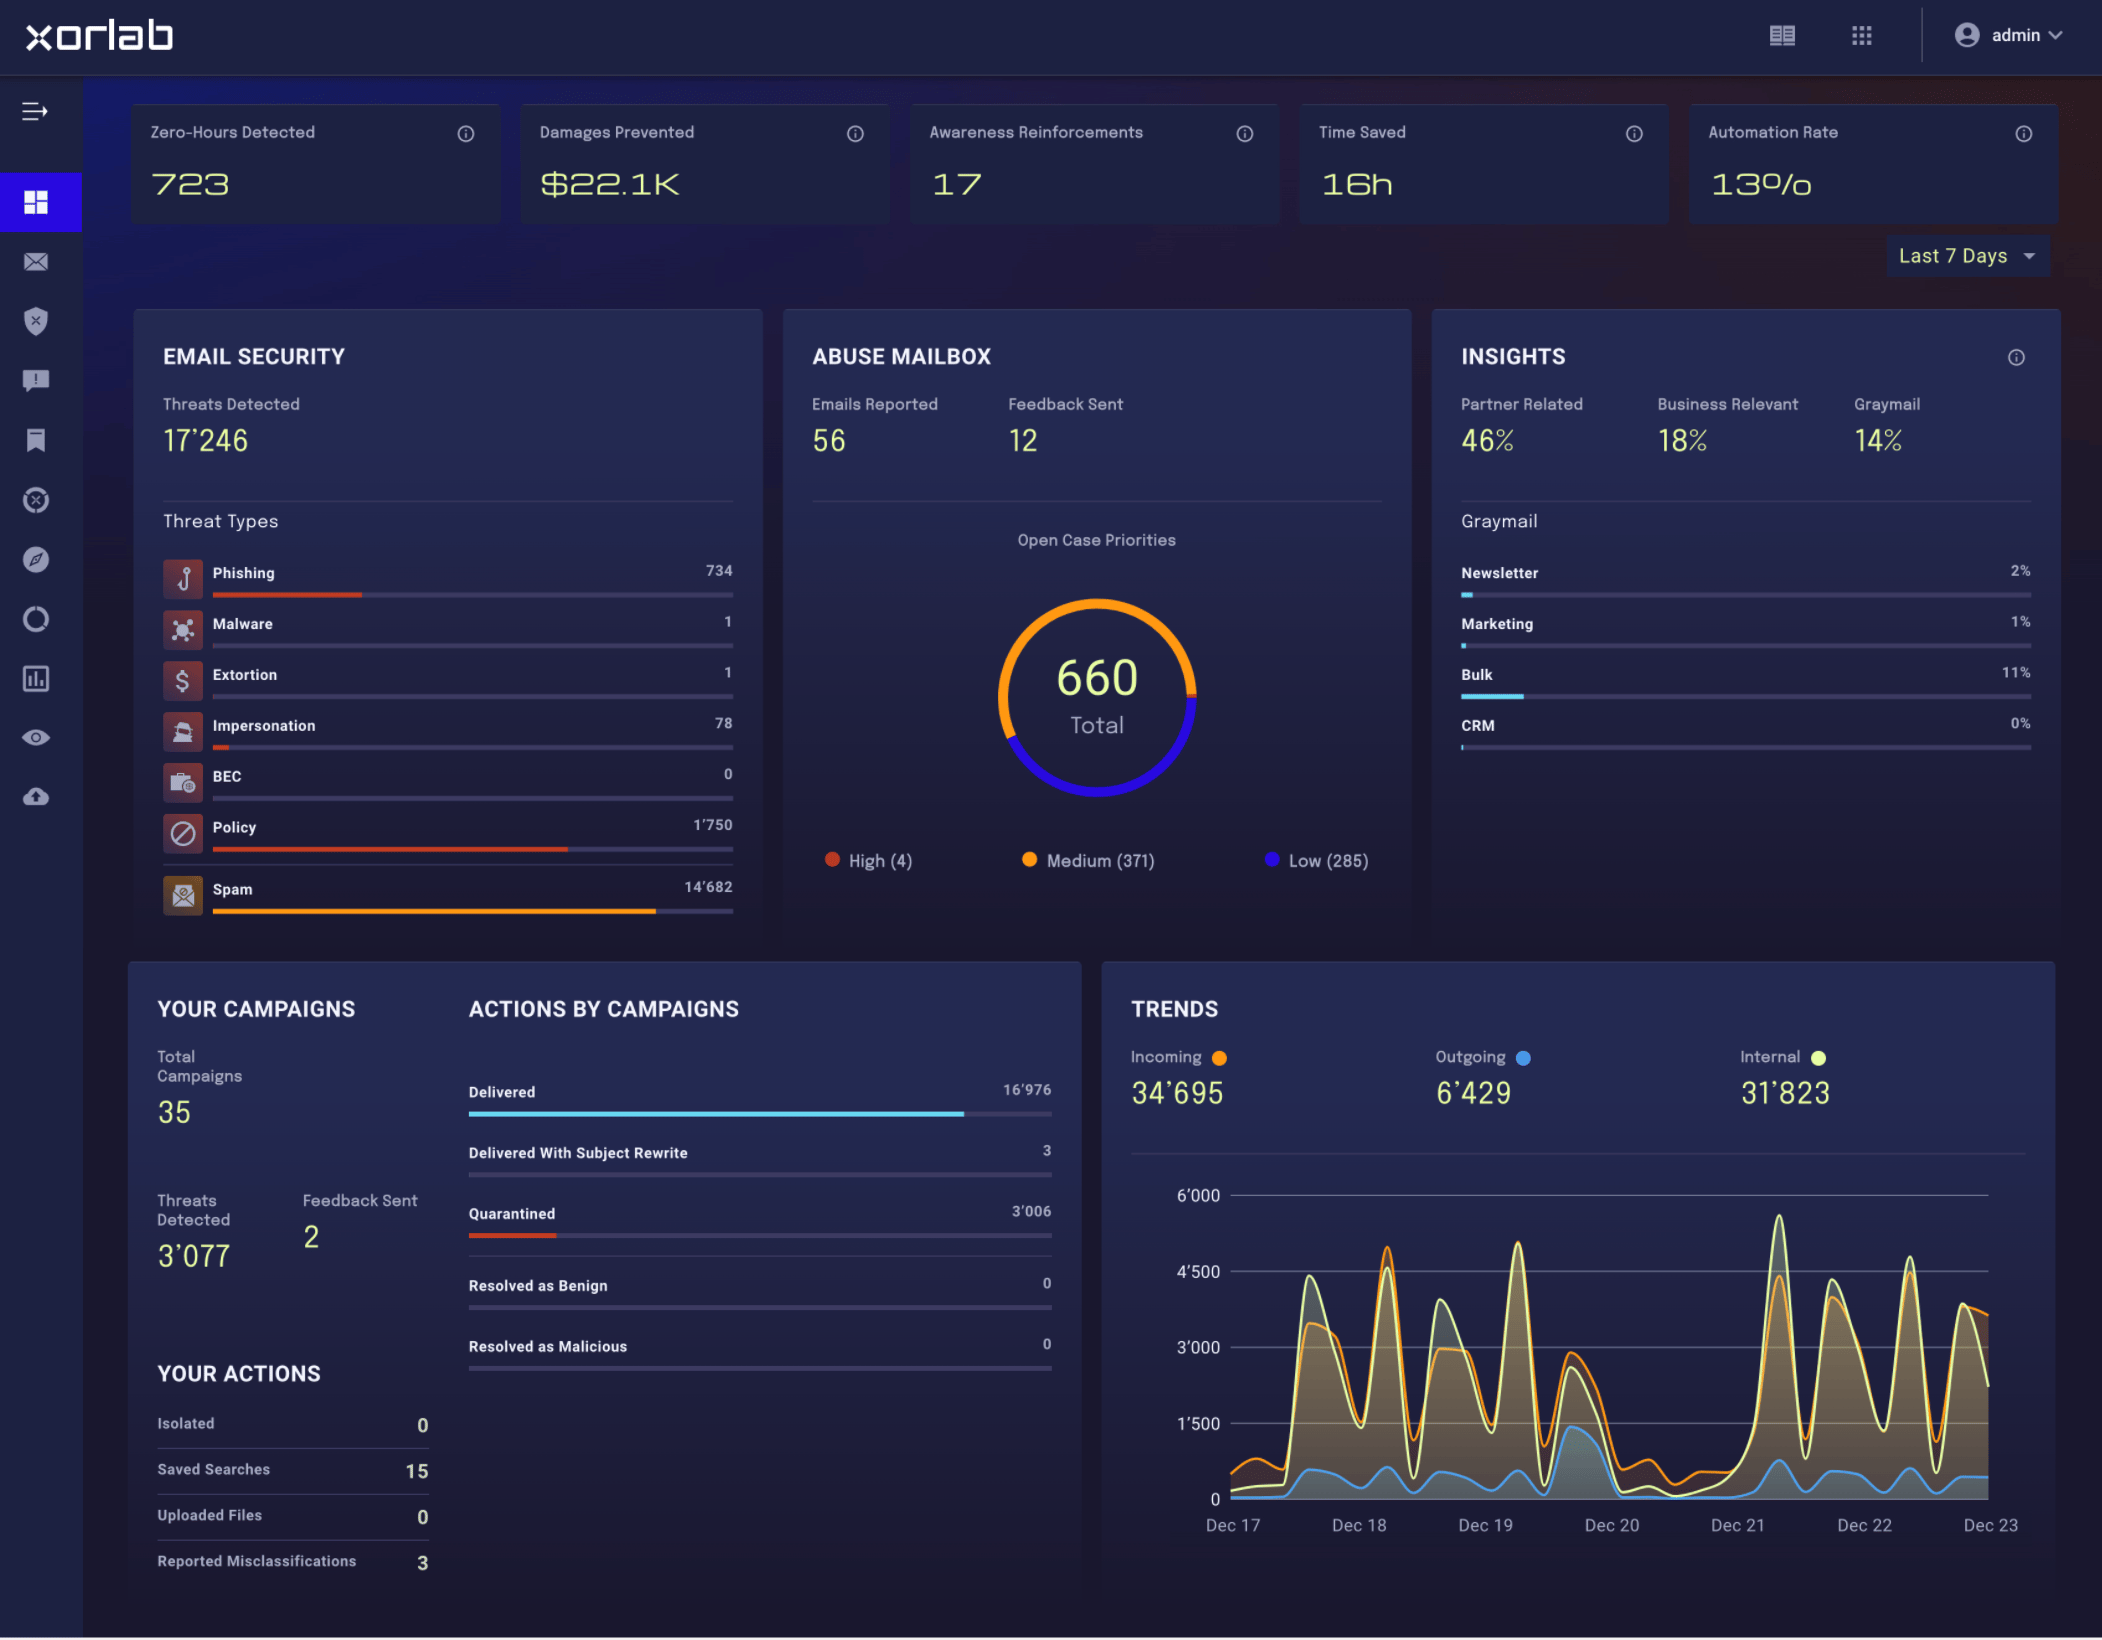
- Messages: A list of All Messages processed by xorlab.
- Quarantines: A list of quarantined messages grouped by a type of threat (malware, phishing, etc).
- Abuse Mailbox: A list of messages reported as suspicious by users and grouped into cases by priority or status, see Abuse Mailbox.
- Saved Searches: A list of your saved custom searches.
- Campaigns: The panel for managing your Campaigns.
- Insights: The panel for accessing statistic information presented as Elastic-powered graphs.
- Threat Intelligence: The panel for accessing more detailed information on main five areas in Elastic-powered dashboards.
- Monitoring: Directs to the Grafana, a centralized access where you can access logs and dashboards, see also Monitoring Guide.
- File Upload: A tool that allows you to manually upload a file to the Sandbox, see File Analysis.
All messages
This page shows an overview of all messages that have been processed by xorlab.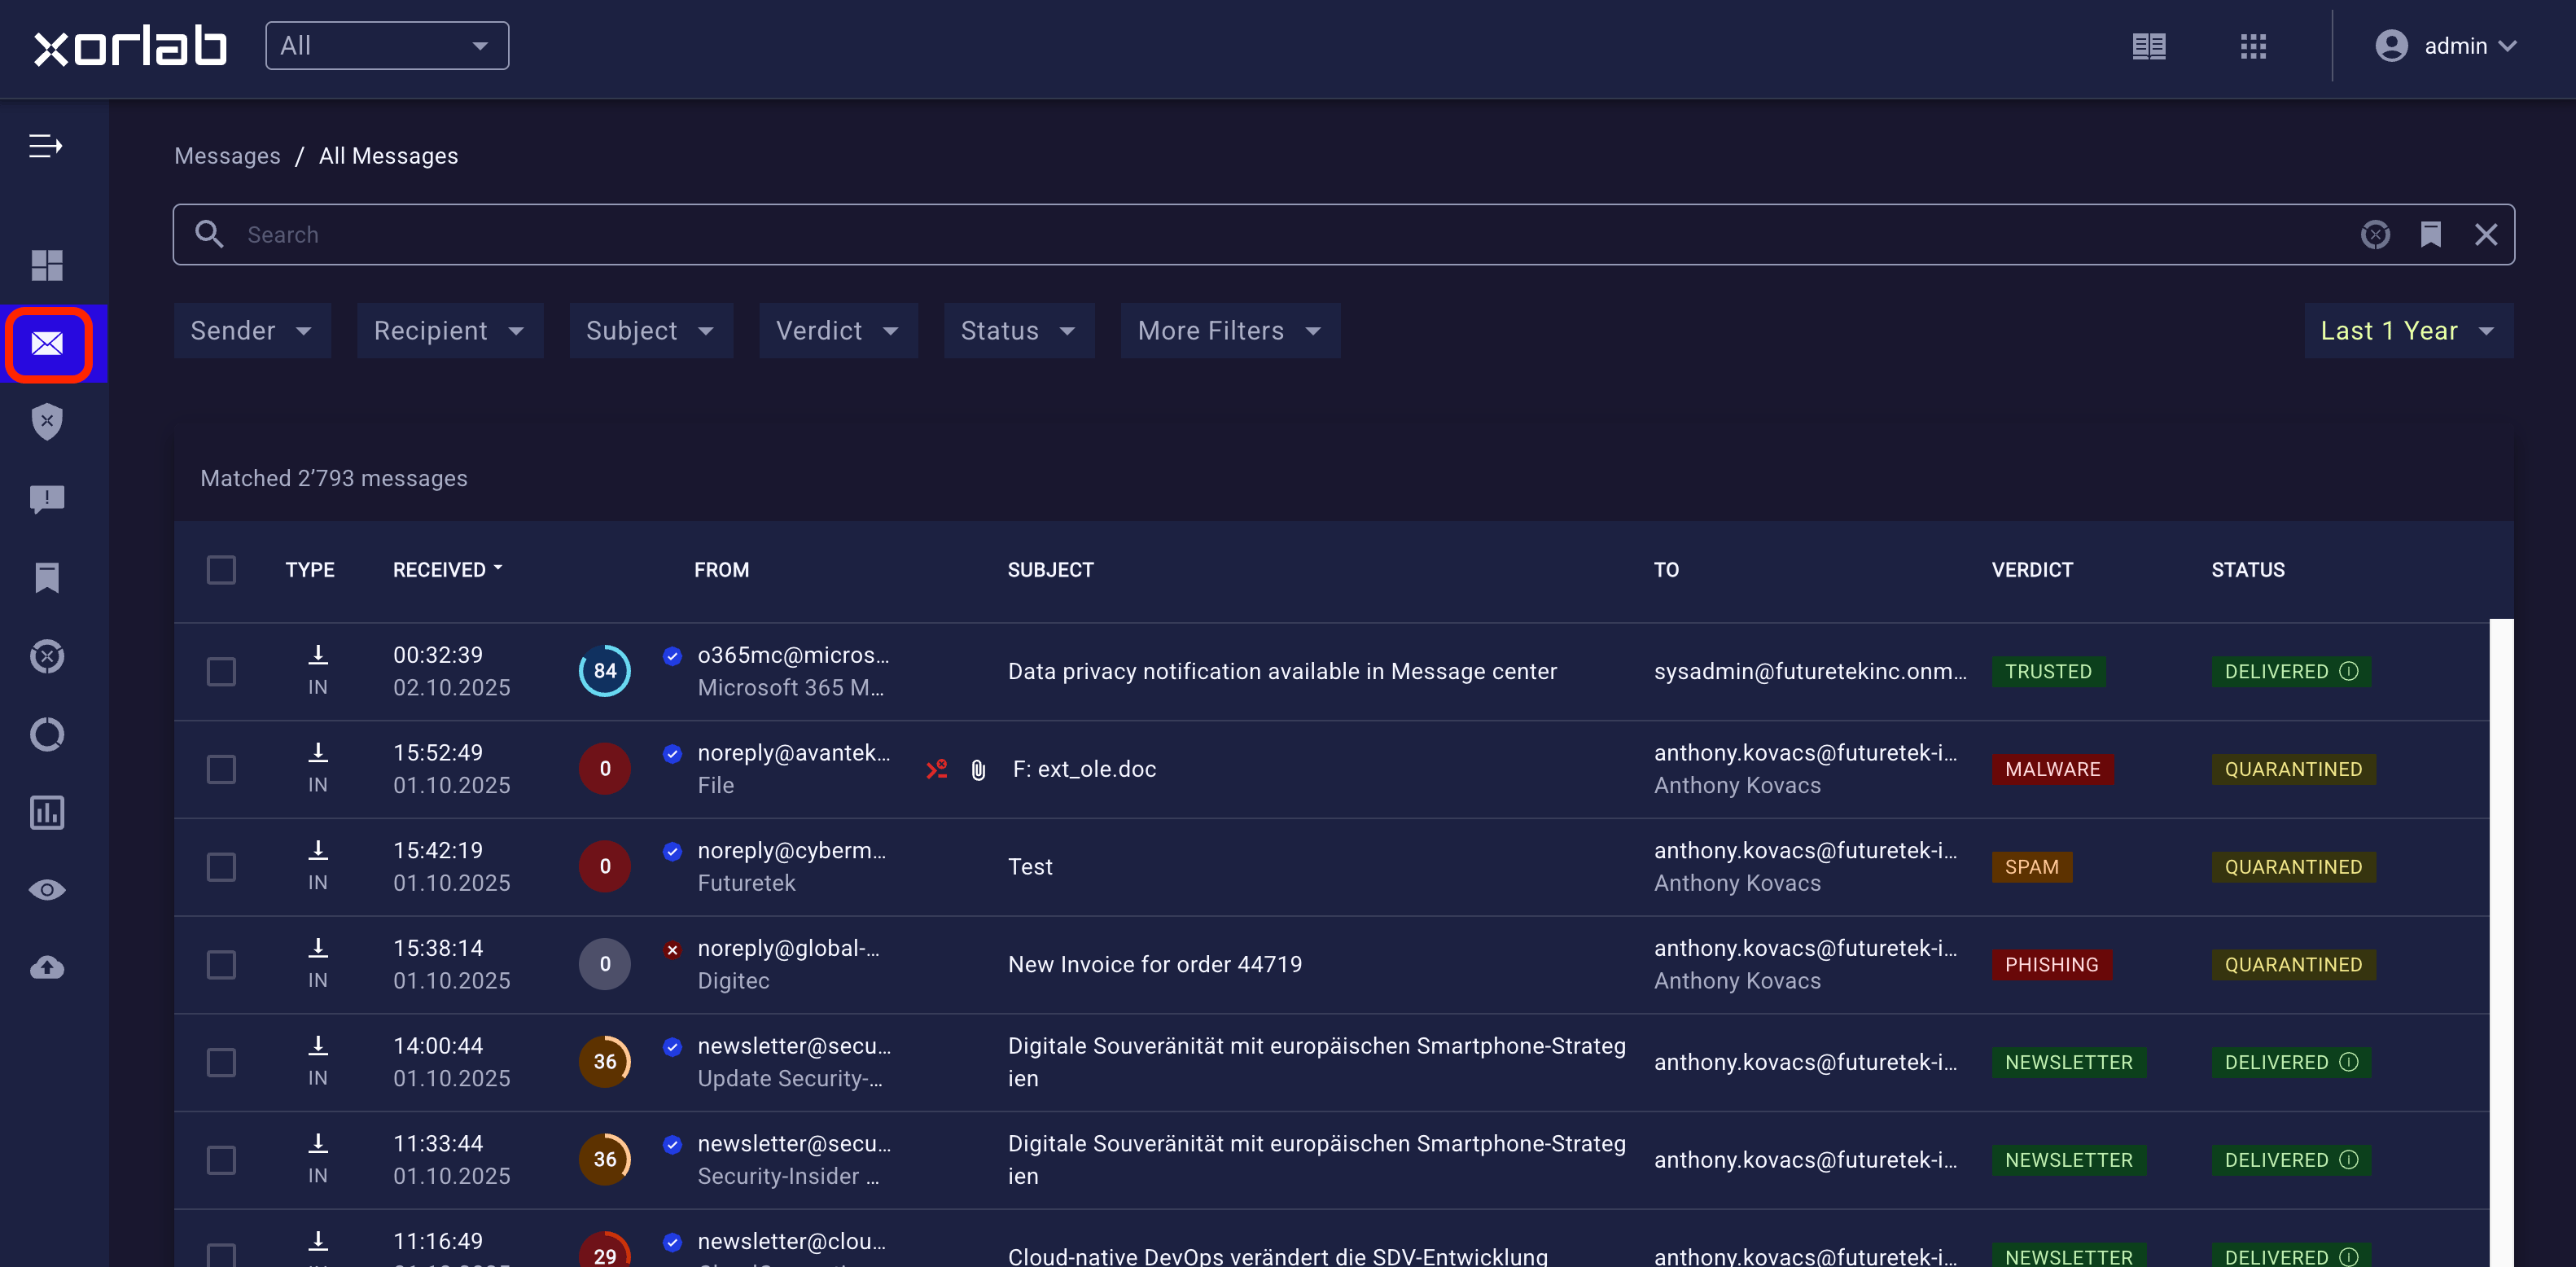
- Type: IN (incoming email), OUT (outgoing email), INT (internal email)
- Received: The timestamp on which xorlab received the email
- Reputation/Trust: A color-coded and numeric indicator. Reflects either trust or reputation, depending on which is more relevant and available.
- Authentication: The blue or gray check symbol. A blue checkmark shows that the sender is authenticated, a gray checkmark indicates broken authentication.
- From: The sender address of the message and the display name of the sender.
- Attachment: A paperclip symbol appears if the email includes one or multiple attachments.
- Subject: The subject of the email.
- To: The recipient address of the message and the display name of the recipient.
- Verdict: Classification of the email, ranging from malicious (red) to benign (blue). Exceptions are spam (orange) and simulation (blue).
- Status: Explains the action that xorlab took with the email. Most frequent actions are either quarantined (yellow) or delivered (green).
- Contextual Banners: If enabled, the Status field might also include a symbol to indicate which contextual banner was applied.