

- Open the Expert Editor.
-
Navigate to
/monitoring/prometheus/prometheus.yml. -
In the
scrape_configssection, find themtascrape job, and replaceexample-mta1/2with the hostnames of your MTA VMs. If you have more MTAs, add more targets with correct hostnames.prometheus.yml - Click Publish. The monitoring configuration becomes active within about one minute; after a few minutes you should start to see data in the monitoring dashboards.
Set up more than two MTAs
This part is only required when you plan to use more than the default of two MTA VMs.-
Navigate to
/monitored_mta/prometheus/. -
Duplicate an existing
prometheus.yml.vmx.Nfile once for each additional MTA. -
For every additional
prometheus.yml.vmx.N: Changeexternal_labels.hostto the name of the respective MTA, e.g.mta3.Note: Setting theprometheus.yml.vmx.Nhostlabel inmonitored_mta/prometheus/prometheus.yml.vmx.Nas opposed to setting them centrally in the XCC Prometheus config, i.e.monitoring/prometheus/prometheus.yml, allows alerts generated on the MTAs to display their own hostname by using{{ $labels.host }}in the alert template. -
Navigate to
/monitored_mta/promtail/. -
Duplicate an existing
config.yml.vmx.Nfile once for each additional MTA. -
For every additional
config.yml.vmx.N: Update thehostslabel to match the MTA:config.yml.vmx.N - Click Publish. The monitoring configuration becomes active within about one minute.
Set up Sandbox monitoring
This part is only required and applicable if you run your own Sandbox appliances (DANA) on-premises.-
Open
monitoring/prometheus/prometheus.yml. -
In the
scrape_configssection, add the followingdanajob to the end. Set a unique<HOSTX>value for each target.prometheus.yml -
In the same file, scroll up and add
dana_alerts.ymltorule_filesto activate alert rules for the Sandbox:prometheus.ymlSandbox AlertsSandbox alerts will trigger on the XCC. As a consequence, if XCC is down, no Sandbox alerts will be created (in contrast to the MTA alerts that are triggered on the MTAs).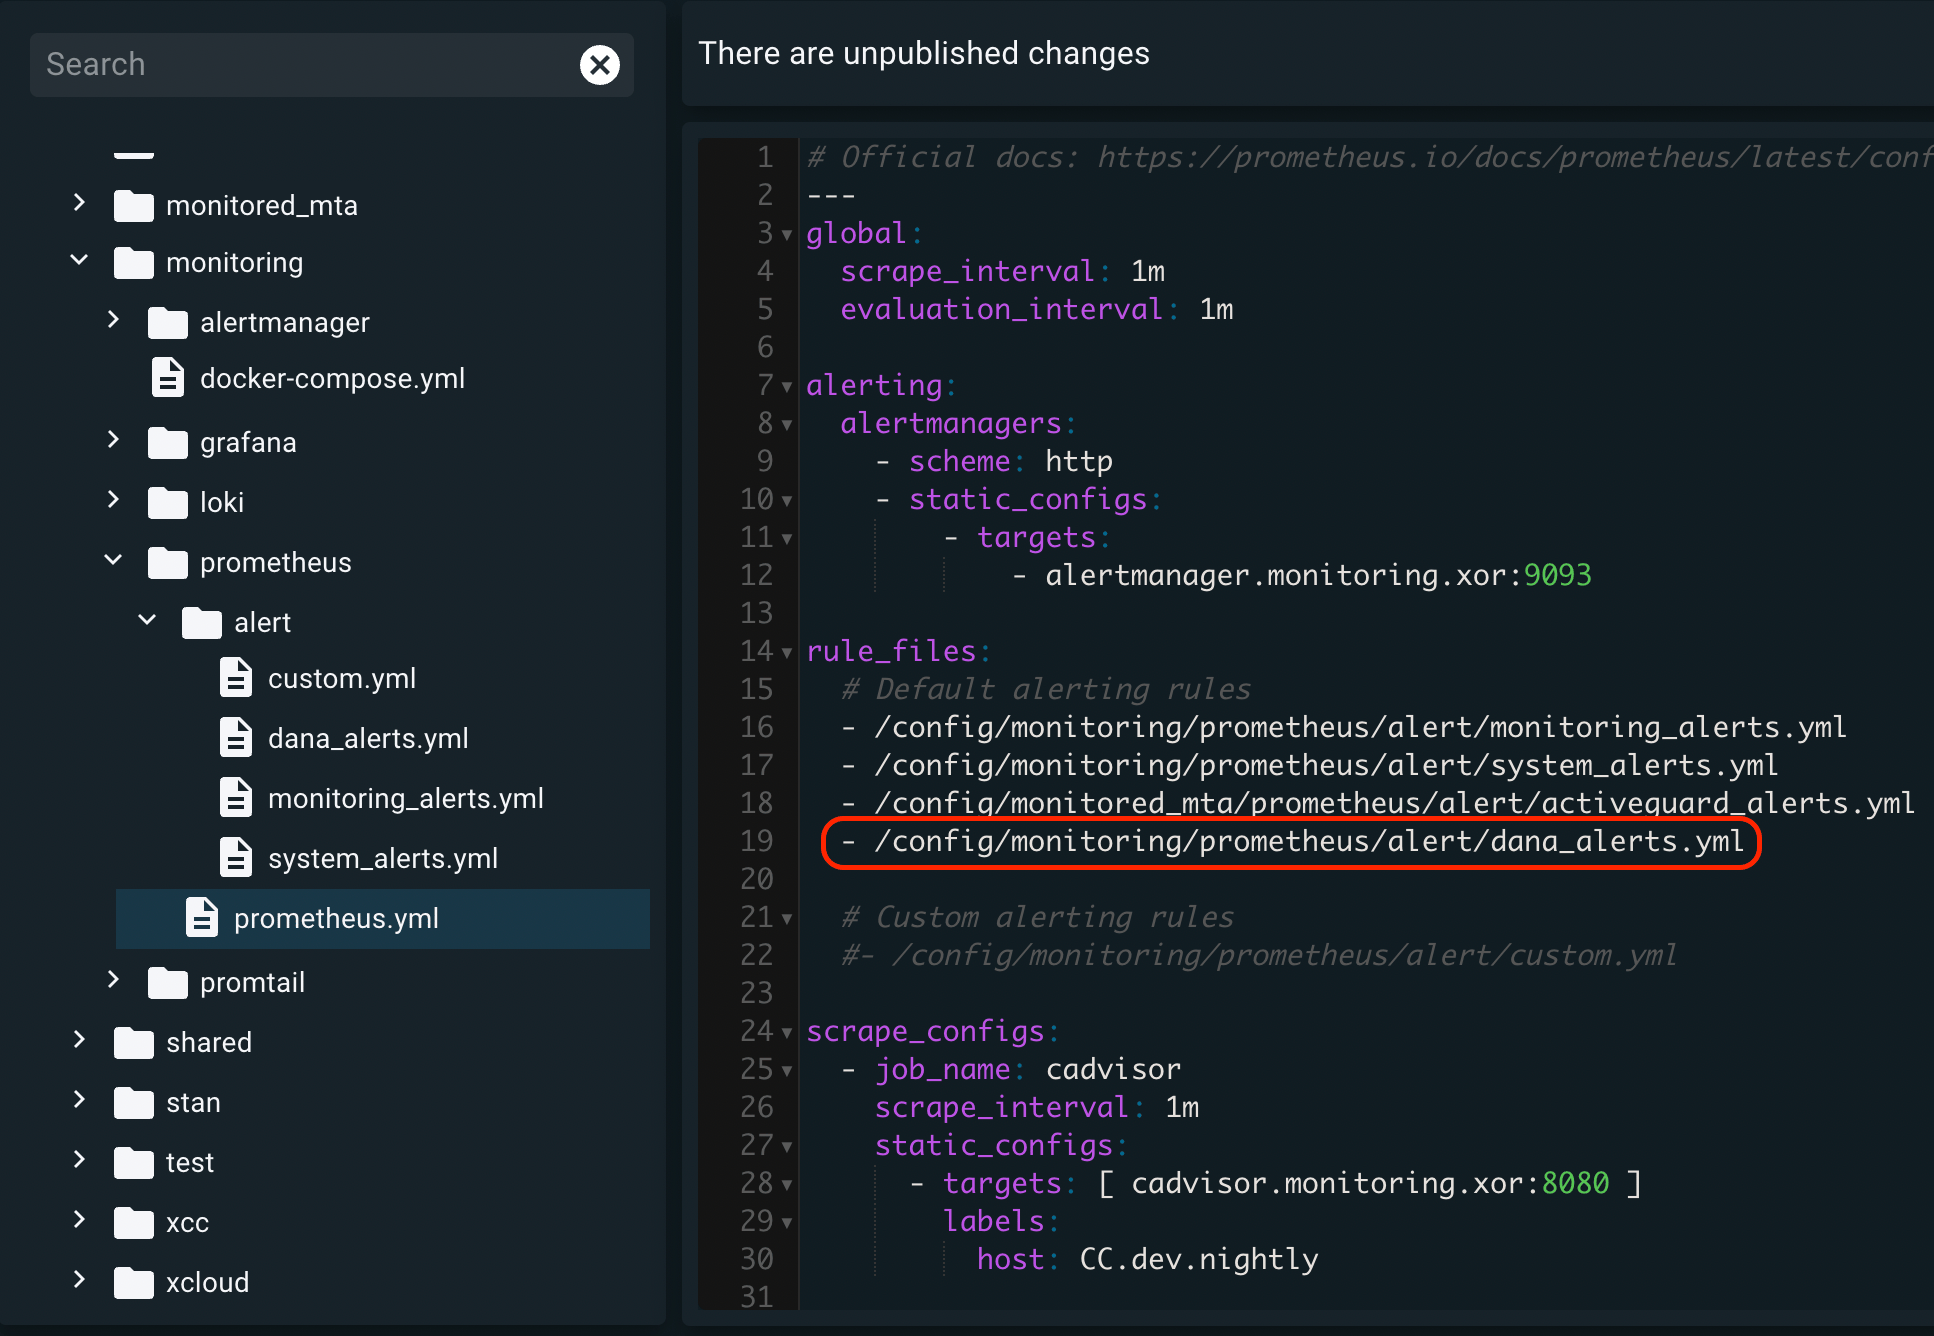
-
Navigate to
monitoring/grafana/provisioning/dashboards/and opencustom.yml -
Uncomment the
DANA Dashboards: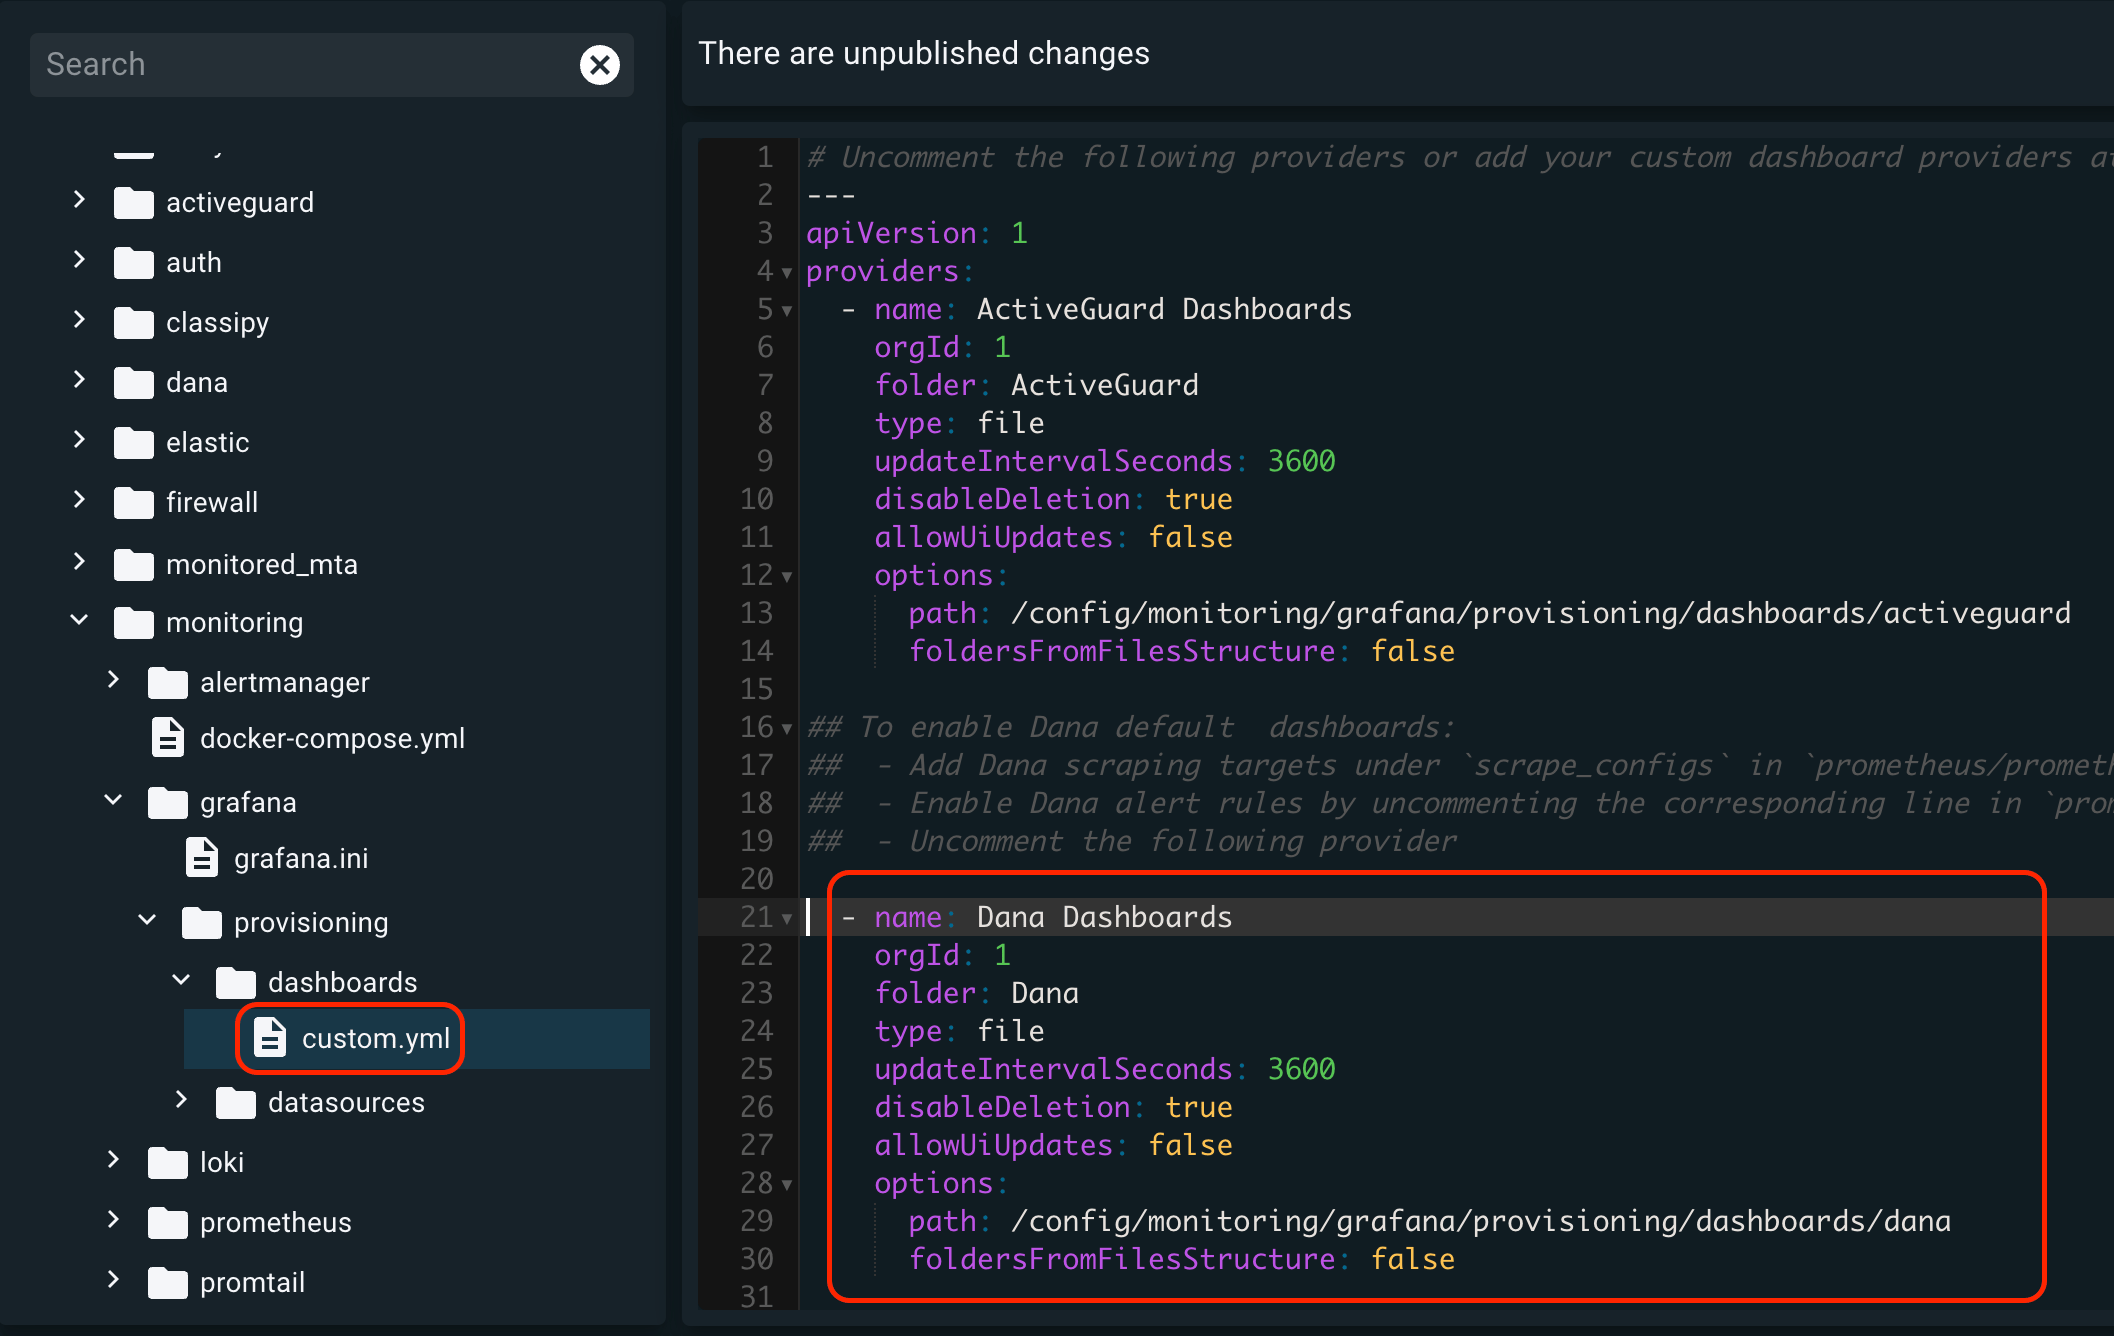
- Click Publish. The monitoring configuration becomes active within about one minute.