

Architecture
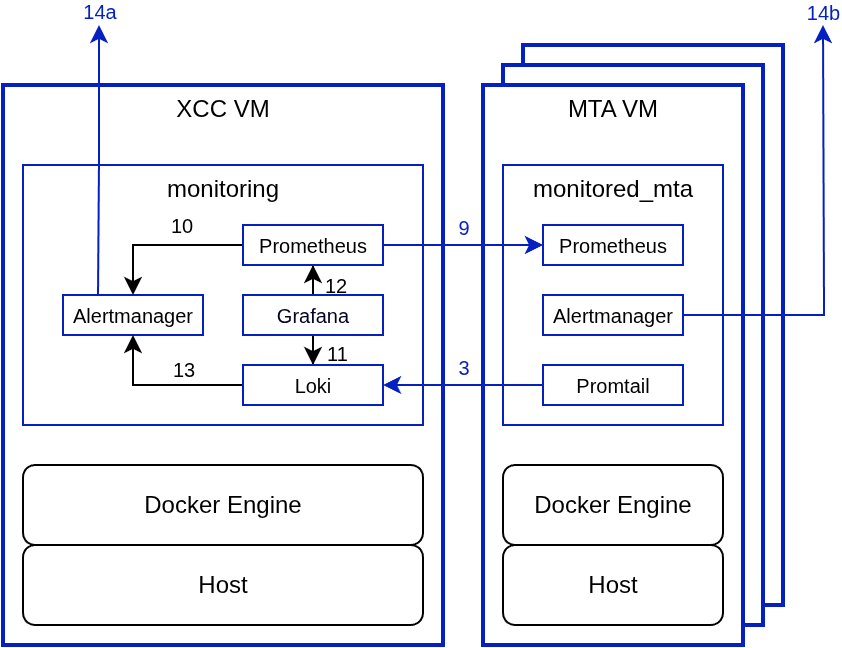
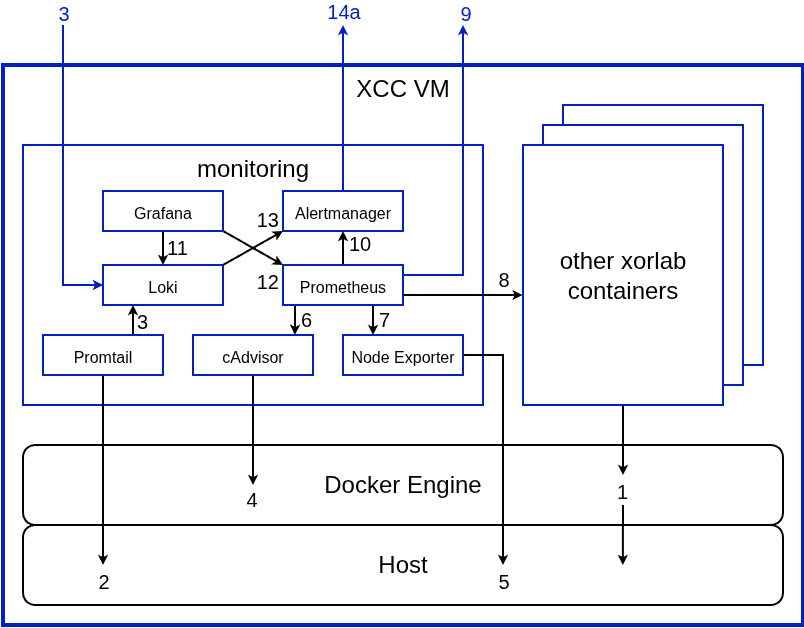
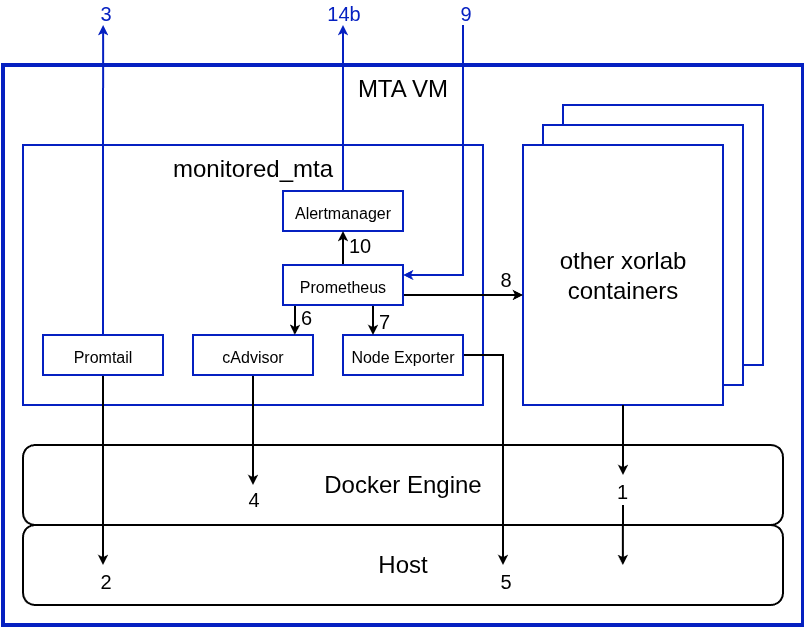
The monitoring stacks, calledmonitoring on the XCC VM (/etc/xorlab/monitoring) and monitored_mta on the MTA VMs (/etc/xorlab/monitored_mta), collect metrics and logs, and offer the option to send alerts based on those metrics/logs to configured receivers. They include the following components:
- Node Exporter to produce host metrics.
- cAdvisor to produce container metrics.
- Prometheus to collect and store metrics.
- Promtail to collect, process, and push logs to Loki.
- Loki to store logs (1)
- Alertmanager to route alerts to various consumers, e.g., via email, Slack, webhooks, etc.
- Grafana to present the metrics and logs on Dashboards, to search system logs and metrics from all VMs with queries, and check alerts. (2)
- Loki is only part of the XCC
monitoringstack and not present on the MTAs. - Grafana is only part of the XCC
monitoringstack and not present on the MTAs.
- Overview
- XCC detailed
- MTA detailed
Logs
All logs written by Docker containers tostdout / stderr are captured by the Docker engine (1) and written to files on the host, where they are parsed by Promtail (2), which pushes the logs to Loki (3). Logs can then be searched and displayed in Grafana (11). Loki can also create alerts based on regular expressions evaluated against these logs and forward these alerts to Alertmanager (13), however xorlab currently does not ship with logs based alerts included in the default configuration.
Configuration overview (to be configured later):
The hostname of the XCC VM needs to be configured in the MTA’s Promtail config.yml, so that Promtail can correctly forward logs to Loki, see Promtail config.
Metrics
Prometheus collects metrics from xorlab containers (8), the Docker engine via cAdvisor (6), and the host via Node Exporter (7). All MTA metrics are first collected by the MTA Prometheus and then federated by the XCC Prometheus (9). Metrics can then be visualized on Grafana. Configuration overview (to be configured later): The hostnames of the MTA VMs need to be configured in the XCC Prometheusprometheus.yml, so that Prometheus can correctly scrape metrics from the MTA Prometheus, see Prometheus config - XCC.
The hostname lables of the MTA VMs need to be configured in the MTA Prometheus prometheus.yml, so that Prometheus can generate alerts using its own hostname label, see Prometheus config - MTA.
Alerts
Alerts based on metrics are created by Prometheus and then forwarded by Alertmanager to the configured receivers. There are two ways to set up alerting:- Alerts for both the MTAs and XCC can be generated centrally on XCC (14a). This is easier to configure but creates a single point of failure for alerting on the XCC VM.
- Alerts for MTAs and XCC can be generated on all VMs separately (14a + 14b), this is more resilient and the recommend configuration.
Configuration
Parts of the initial configuration were set by the setup scripts. However, some parts need to be configured manually. The following assumes a setup with two MTAs, for setups with more than two MTAs the configuration needs to be expanded accordingly.XCC Monitoring Configuration
Prometheus config - XCC
In order for the XCC Prometheus to be able to scrape MTA metrics, the URLs of the MTAs need to be set inprometheus.yml.
- Open the Expert Editor.
-
Navigate to
/monitoring/prometheus/prometheus.yml. -
In the
scrape_configssection, find themtascrape job, and replaceexample-mta1/2with the hostnames of your MTA VMs. If you have more MTAs, add more targets with correct hostnames. - Click PUBLISH and enter a description of your changes to commit them, or continue with the next section and publish your changes at the end of the configuration.
MTA Monitoring Configuration
Templating
Config files might differ between different MTAs, for example if they contain the hostname or other configuration specific to a certain MTA. To address this the internal config service of xorlab uses templating and the expert GUI will show the filename with a suffix.vmx.<client_id>, where <client_id> the clientID is set in the bootstrap.env/yml files of the different stacks, see also VM Setup Guide. Consider the following example:
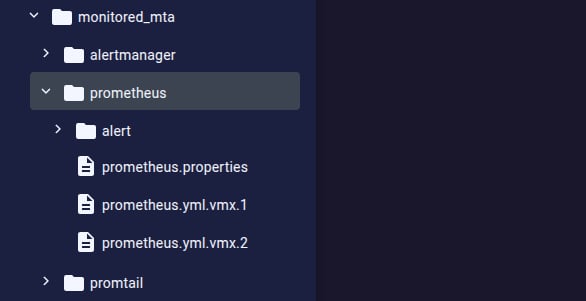
prometheus.properties, but MTA1 will receive a file named prometheus.yml with the content of prometheus.yml.vmx.1, whereas MTA2 will receive a file named prometheus.yml with the content of prometheus.yml.vmx.2.
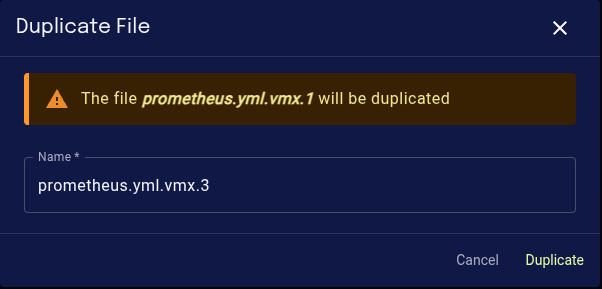
If you are configuring a setup with more than two MTAs, duplicate the respective config file in the GUI:
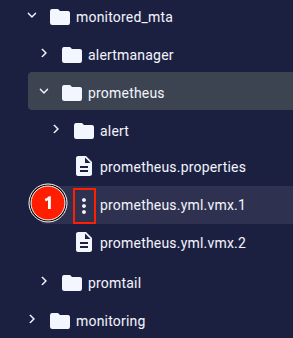
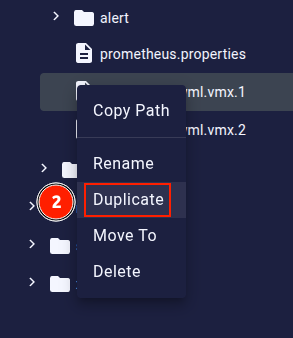
prometheus.yml.vmx.3.
Prometheus config - MTA
In order to correctly label metrics and alerts, thehost label needs to be set in the prometheus.yml.vmx.N config files.
- Open the Expert Editor.
-
Navigate to
/monitored_mta/prometheus/prometheus.yml.vmx.N. -
Change
external_labels.hostto the name of the respective MTA, e.g.mta1.
host label in monitored_mta/prometheus/prometheus.yml.vmx.N as opposed to setting them centrally in the XCC Prometheus config, i.e. monitoring/prometheus/prometheus.yml, allows alerts generated on the MTAs to display their own hostname by using {{ $labels.host }} in the alert template.
- Click PUBLISH to commit the changes and restart Promtail for the changes to take effect. See also How to Activate the Configuration, or continue with the next section and publish and restart and the end of your changes.
Promtail config
In order for Promtail to push logs to Loki, the URL of the Loki API endpoint needs to be set in the Promtail config of the MTAs.- Open the Expert Editor.
-
Navigate to
/monitored_mta/promtail/config.yml.vmx.N. -
Find the
clientssection, and change theurl, so that it points to the XCC VM’s hostname. - Click PUBLISH to commit the changes and restart Promtail for the changes to take effect. See also How to Activate the Configuration, or continue with the next section and publish and restart and the end of your changes.
Optional Settings
Logs retention period
- Go to the Expert Editor.
-
Open the
/monitoring/loki/local-config.yml. -
Change the default value for the
limits_config.retention_periodto set the logs retention period. For a daily load of 100 000 emails, approximately 2.5 GB of disk space is required for the default log retention period of 31 days. - Click PUBLISH to commit the changes and restart Loki for the changes to take effect. See also How to Activate the Configuration.
Metrics retention period
You can change the retention time for the metrics stored on the XCC and MTAs independently, by adjustingstorage.tsdb.retention.time=30d in file prometheus.properties.
The XCC Prometheus is used for visualizing data on Grafana, while the MTA Prometheus is used only to federate data from other components on the MTAs.
- Go to the Expert Editor.
-
Open the:
-
/monitoring/prometheus/prometheus.properties(XCC) -
/monitored_mta/prometheus/prometheus.properties(MTA, changes apply to all MTAs, unless this file is templated)
-
-
Uncomment the following highlighted lines, and enter the desired values:
- Click PUBLISH to commit the changes and wait one minute for the Prometheus to reload the config. See also How to Activate the Configuration.